
Equities finished the penultimate trading day of June on a positive note. The small cap. Russell 2000 paced the advance adding 1.00% while among the prominent large cap. indices the Nasdaq Composite added 0.30% while the S&P 500 and the Dow Industrials each added 0.09%.
Futures for the Nasdaq and the S&P 500 are positive this morning with up 0.41% and 0.33% respectively as of this writing.
Thursday saw mixed results beneath the surface as WBA plummeted more than 22% on a big earnings miss. MU also fell by more than 7%. On the plus side of the ledger, software stocks benefitted from bets that AI would trigger a new round of interest. PANW, ADBE and CRM all added more than 3% while SMCI added >7% on strong demand for its servers.
A busy economic calendar again for Friday with key PCE data being released before the bell. UofM data is also due out in the morning.
Absent a material change in the cadence of the economic data the market trends remain in favor of the Tech Sector and mega cap. Growth stocks. The bull trend at the index level remains intact, while interest rates via unremarkable inflation prints YTD have cooperated to keep that risk on the sideline. As we look to allocate our sector positions for July we are finding it hard to discern which way investors would rotate if Tech and Growth were challenged. Rates and Commodities prices are both in consolidation. At present our process gives the nod to the bull, and we will watch today’s price action with interest for any further clues.
Eco Data Releases | Friday June 28th, 2024
| Date Time | Event | Survey | Actual | Prior | Revised | |
| 06/28/2024 08:30 | Personal Income | May | 0.40% | — | 0.30% | — |
| 06/28/2024 08:30 | Personal Spending | May | 0.30% | — | 0.20% | — |
| 06/28/2024 08:30 | Real Personal Spending | May | 0.30% | — | -0.10% | — |
| 06/28/2024 08:30 | PCE Price Index MoM | May | 0.00% | — | 0.30% | — |
| 06/28/2024 08:30 | PCE Price Index YoY | May | 2.60% | — | 2.70% | — |
| 06/28/2024 08:30 | Core PCE Price Index MoM | May | 0.10% | — | 0.20% | — |
| 06/28/2024 08:30 | Core PCE Price Index YoY | May | 2.60% | — | 2.80% | — |
| 06/28/2024 09:45 | MNI Chicago PMI | Jun | 40 | — | 35.4 | — |
| 06/28/2024 10:00 | U. of Mich. Sentiment | Jun F | 66 | — | 65.6 | — |
| 06/28/2024 10:00 | U. of Mich. Current Conditions | Jun F | 64 | — | 62.5 | — |
| 06/28/2024 10:00 | U. of Mich. Expectations | Jun F | 68 | — | 67.6 | — |
| 06/28/2024 10:00 | U. of Mich. 1 Yr Inflation | Jun F | 3.20% | — | 3.30% | — |
| 06/28/2024 10:00 | U. of Mich. 5-10 Yr Inflation | Jun F | 3.10% | — | 3.10% | — |
| 06/28/2024 11:00 | Kansas City Fed Services Activity | Jun | — | — | 11 | — |
S&P 500 Constituent Earnings Announcements by GICS Sector | Friday June 28th, 2024
No S&P 500 Constituents Reporting Today
Factor Friday
A quick survey of our favorite factors including size, momentum, Growth vs. Value, and High Beta vs. Min Vol. further illustrates the muddle for investors looking to position one way or another on the periphery. Growth dominates Value in the near-term from all market cap. tiers.
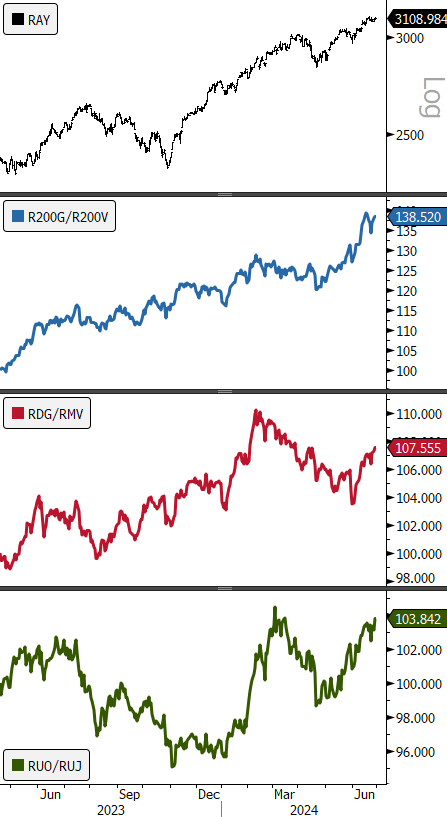
- Russell 3000
- Mega Cap. Growth/Mega Cap. Value
- Mid-Cap. Growth/Mid-Cap. Value
- Small-Cap. Growth/Small-Cap. Value
What has been more ambiguous is the tug of war between high beta and low vol. stocks. The feedback loop plays out most perniciously among the laggard sectors where high beta Materials stocks in the XLB have suffered almost equally to low vol. utilities co’s in the XLU. The policy ambiguity mixed with the strength of the AI tailwind has marginalized a majority of the sectors as manifested by their performance.
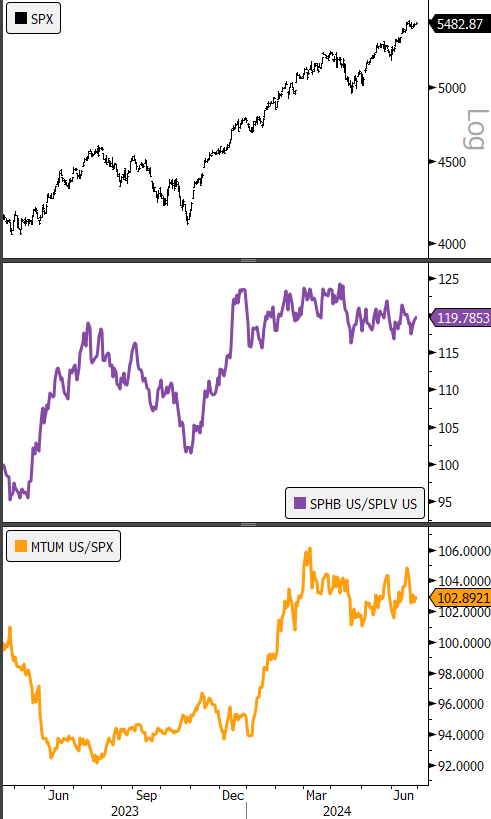
- S&P 500
- S&P High Beta /S&P Low Vol.
- MTUM—iShares MSCI Momentum ETF/S&P 500
Sector relative curves reflect the hesitancy from investors to bet on either high beta or low vol. as every sector SPDR beyond XLK and XLC has underperformed the benchmark over the past 12 months as seen in the chart below.
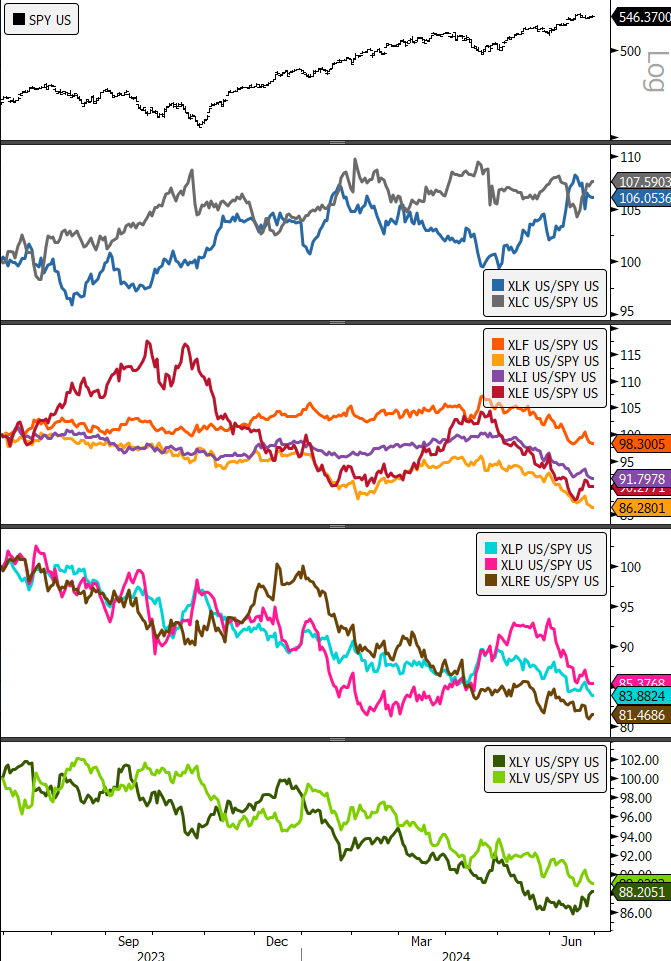
- SPY
- XLK/SPY, XLC/SPY (all relative curves rebalanced to 100 at start of chart)
- XLF/SPY, XLB/SPY, XLI/SPY, XLE/SPY
- XLP/SPY, XLU/SPY, XLRE/SPY
- XLY/SPY, XLV/SPY
Sources: Bloomberg
