
Narrations of a Sector ETF Operator | Weekly Market Letter, July 28, 2024
I want to be a “dip” buyer. Do you? It’s great. You get to buy an asset in a strong trend on a quick discount, make some near-term money on the anticipated bounce and then continue to ride the trend. But there are problems. How deep is the dip? What are the odds? Could it be trend change?
With NVDA off > 20% in the past weeks and the XLK down double-digits (-11.59%) as well, is this a big enough dip that we should buy it? I use macro and sector fundamental data to assess the foundations of trend as rooted in the underlying economy, but I use technical analysis to spec out scenarios like this. Let’s look at the technical status of the near-term correction in XLK Technology Sector shares, the Nasdaq Composite Index and the bull market’s favorite stock NVDA to see where we are in the current correction and what the risk reward is of entering at present vs. waiting on a deeper decline.
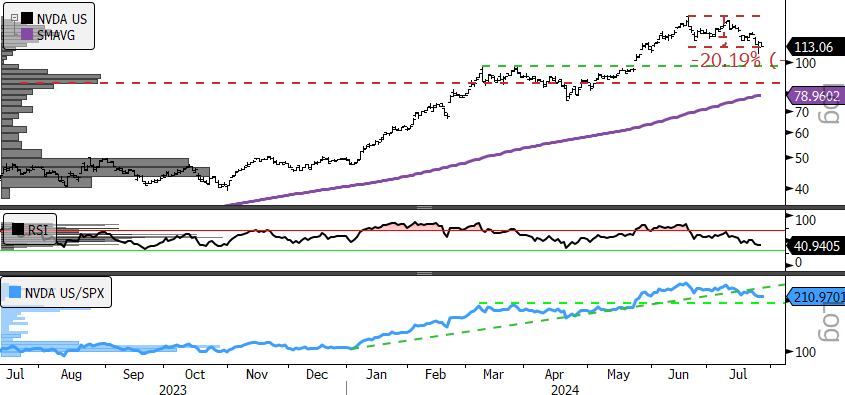
Below is a 1yr daily chart of NVDA sporting its 20+% decline in the near term. Strong support for the stock comes in at the $96 level. That is our max draw-down scenario if the S&P 500 remains above its point of control currently at 5070. We can see the relative curve is also still above 1Q2024 levels which act as another gage of the uptrend. The RSI momentum gage is also near oversold levels without an obvious momentum divergence preceding the move. At present this looks like a buyable dip, and we would like a fill near $100 if we can get it.
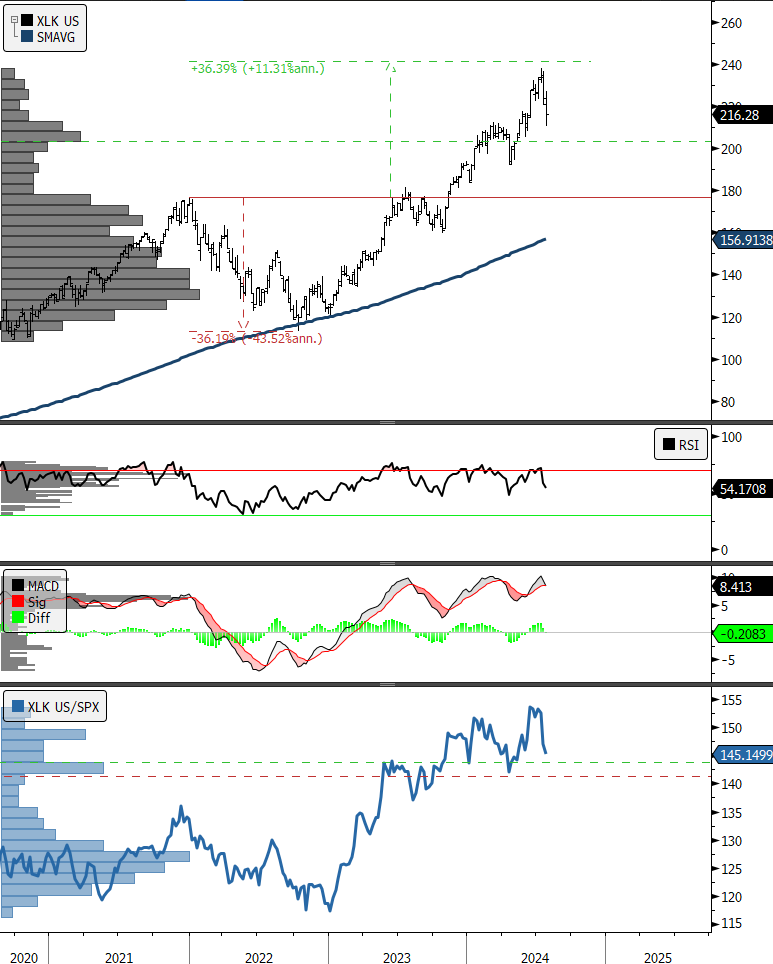
Let’s turn our attention to the XLK Technology Sector SPDR. The phrase “victim of your own success” comes to mind. The Sector was in spitting distance of a long-term upside price target at $241 generated by breaking out to new highs in the summer of 2023. Price currently sits at $216 with the RSI near uptrend oversold levels. We have seen some negative divergence forming on the gage, but we are still far short of trend change and we would expect a good entry point on the chart is just above $200 which is the bottom of the most recent price congestion zone on the chart. A max drawdown scenario is a potential retest of the 2022 price high for the sector at $178.
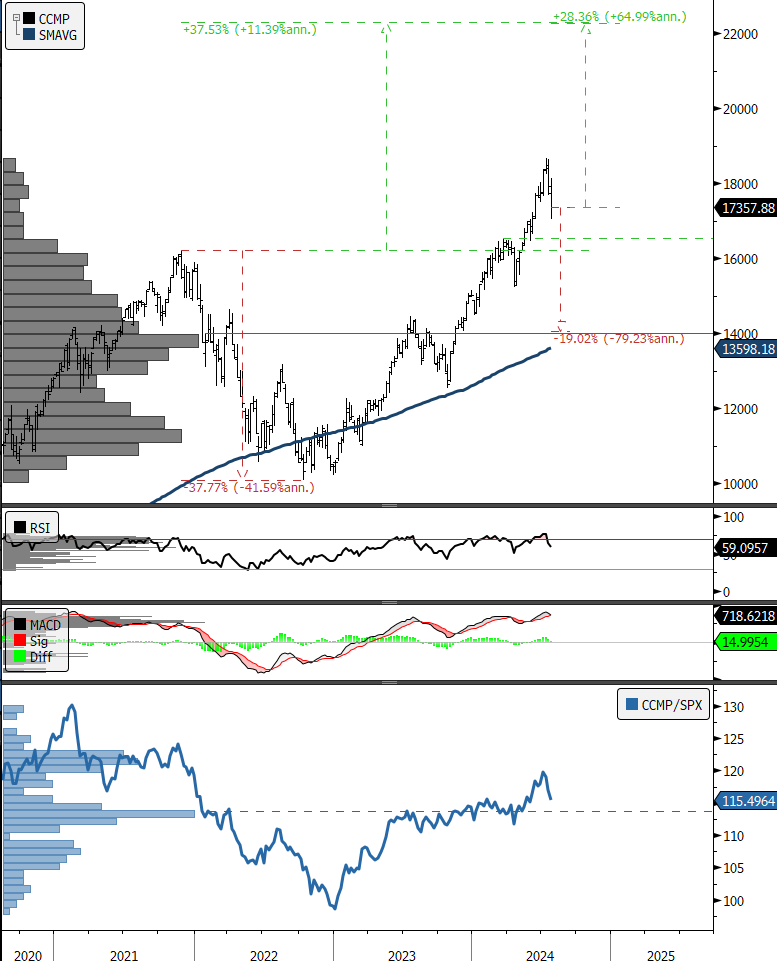
Finally, a look at the Nasdaq Composite Index. Here you have a max draw-down scenario of 19.02% to the point of control on the chart. However, the CCMP chart sets up with more upside based on a projected long-term price target of 22271 representing >28% upside. We believe a good entry point would be in the neighborhood of 16500 given the chart setup.
Why do we have conviction in being dip buyers? It is rooted in behavior. We know that typical non recessionary yearly max drawdowns in equity markets average between 10 and 20% while recessionary drawdowns average near 40%. We are seeing some mild sluggishness in the data, but now signs of outright contraction at present. We will switch to opportunism when the near-term discount or “sale” gets big enough. We know any buying in the most powerful trends often enjoys a “FOMO” effect and we haven’t seen long-term negative divergence in our momentum oscillators. We think the charts have us close to an opportunity point.
–Patrick Torbert, CMT | Chief Strategist, ETFsector.com
ETF’s/The Week in Review
Sectors
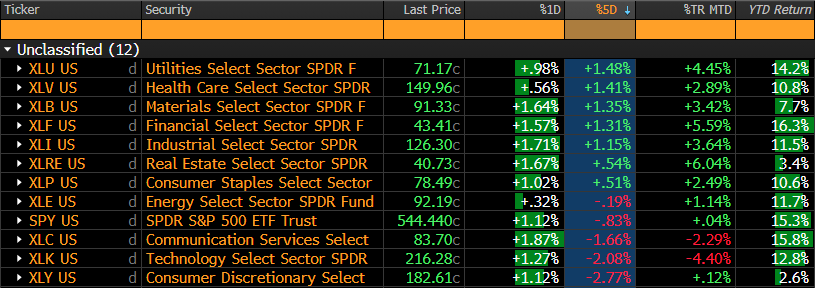
More reversion from previous YTD winners has reached a milestone this week. The XLK and XLC are no longer our best performing sectors of 2024. That honor now belongs to the XLF. Over longer timeframes, the Mega Cap. Growth dominated sectors have still outperformed but the script has flipped, and Value and Defensive oriented sectors are gaining on the index.
What are the clues from the Macro? Commodities Prices About to Show Their Hand
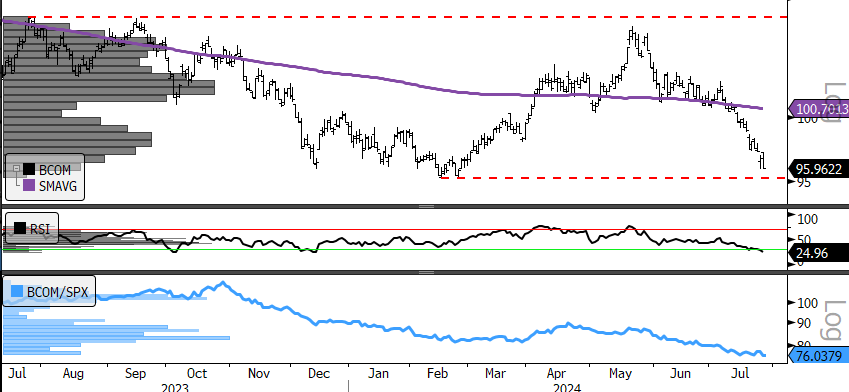
We would be more inclined to distance ourselves from the XLC and the XLK if we were confident that the recent reversion in sector performance was related to a robust economy. However, the catalyst is policy easing, which does presuppose a certain softness in things like industrial production, manufacturing, inventory drawdown and other things that drive demand and inflation. Our gage at times like this is the Bloomberg Commodities Index. It is at a potential inflection point on its price chart presently and how that resolves will help us figure out how to position our sector portfolio for August.
As we can see in the chart below, 95 is a key support level. Breaking that to the downside is speculators vote of “no confidence” in continued economic expansion and would have us favoring a defensive allocation over a pro-cyclical one. At the same time, oversold and at support is where we are, and we should expect a bounce all things being equal. That’s why in the next few days the BCOM chart will be an important one to watch.
Crude Oil and Interest Rates have been shown a bias to the downside as well in the near term and we don’t usually see cyclicals outperform sustainably when that is the case.
Source: Bloomberg
