
ETFsector.com Daily Trading Outlook, August 9, 2024
Equities whip-sawed violently higher on Thursday after Wednesday’s session finished in disappointing fashion. Better jobless claim data was cited as the bullish spark which saw the Dow add 1.76%, the S&P 500 up 2.38% and the Nasdaq Composite lead higher up 2.87%. Investors can be excused for feeling dizzy.
At the sector level month-to-date leaders were laggards as XLU, XLRE and XLP brought up the rear while the XLK was the only SPDR that outperformed the S&P 500. This was a mirror image of the recent decline where XLK was often the nexus of selling.
Yields rose with the 2yr moving back above the 4% level settling at 4.038% while the 10yr Yield rose to 3.987%. Commodities prices were also firmer though WTI finished the day off 0.2% at $76.03.
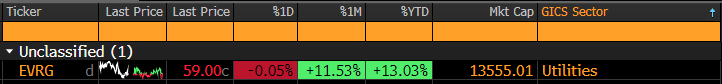
Friday’s calendars are light with just one S&P 500 constituent, EVRG, reporting before the bell. No major economic data releases are scheduled for Friday.
Correction Watch: Price Still Below Key Resistance
Thursday’s price action was short of a material bullish reversal, and we would need to see prices move above the 5450-5500 range to feel confident betting on upside. The S&P 500 YTD chart below shows the price congestion zone at that level which is the near-term point of control on the chart. On the other hand, a move below 5200 would signify more technical damage.

- S&P 500 daily, YTD (RSI | MACD)
- Price is short of congestion and the MACD oscillator is still short of a pivot buy signal. Remain cautious for now
Eco Data Releases | Friday August 9th, 2024
No Releases Scheduled for Friday
S&P 500 Constituent Earnings Announcements by GICS Sector | Friday August 9th, 2024
Factor Friday
Since headline US equity turbulence kicked off in mid-July, it’s been all Value over Growth and Small and Mid have gained on Large cap. However, we are seeing retracement in R2K shares in the near-term. Also, the relative curve of the Russell Mid-Cap. Growth Index looks interesting here (Chart, Panel 3), like it is trying to turn as it reaches equilibrium levels with Value in the near term.
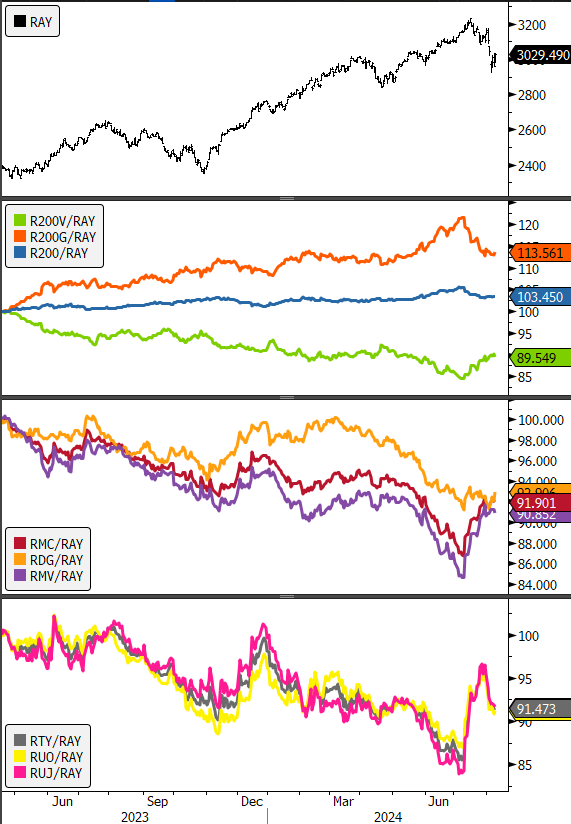
- Panel 1: Russell 3000
- Panel 2: R200, R200 Growth, R200 Value (Relative to R3K)
- Panel 3: Russell Mid-Cap. Growth Value (Relative to R3K)
- Panel 4: R2K Growth Value (Relative to R3K)
Sources: Bloomberg
