
It has been a rough month for trend-followers as negative news on employment and manufacturing data pointed to contraction to start the month, only for non-manufacturing employment, inflation data and retail sales to come in better than expected. This resulted in an enthusiastic “buy the dip” dynamic. The S&P 500 is back within a few percentage points of its all-time high and it has had us adding some risk back into the Portfolio by re-establishing our long in XLK on August 18. Our new positioning is as follows:
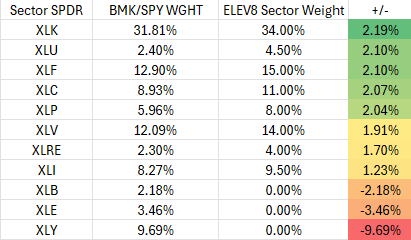
Portfolio Rebalance: Re-enter Long XLK, Funding from Longs in XLRE, XLU, XLI, XLP, XLV
XLK has broken above its previous near-term price high at the $220 level (Chart below), signaling technical bullish reversal. The S&P 500 Index has manifested similar price action and has reclaimed its bullish stance on strong buying power in the near term. While we observe softness in employment, consumer spending data and manufacturing data, we respect the Fed. policy shift and the cadence of corporate earnings which have delivered good enough results and encouraging guidance, particularly in the XLK.
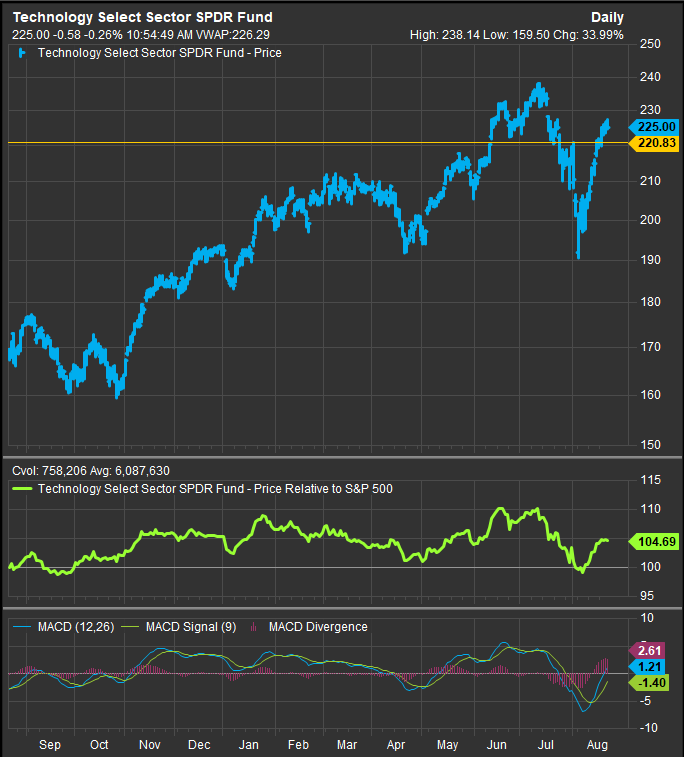
- XLK daily, 1 year (Relative to S&P 500 | 12, 26, 9 MACD)
- We expect the 220 level to act as support in the near term
The S&P 500 is also through resistance and can now expect the 5509 to 5566 level to act as a zone of support. See the chart below.
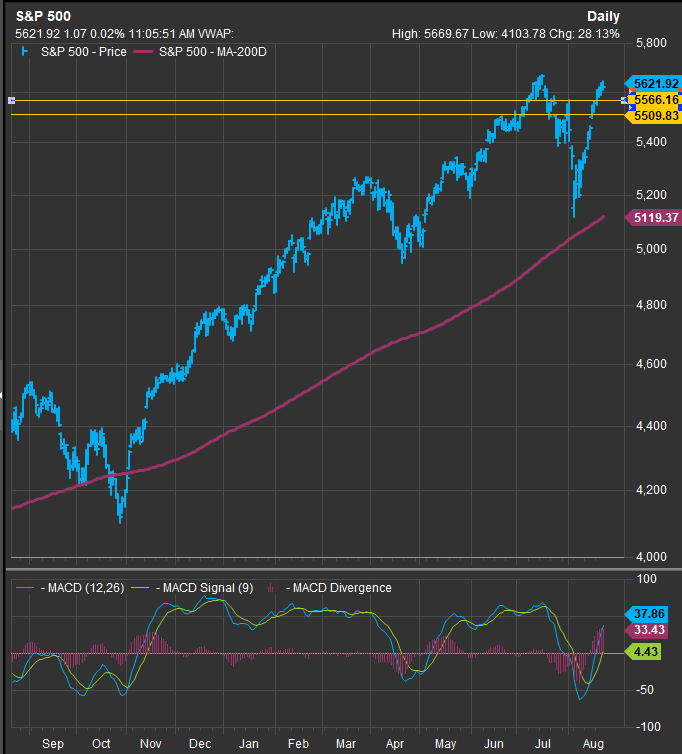
- S&P 500 daily, 1 year (200-day moving average | 12, 26, 9 MACD)
Still Out of XLY, XLB, XLE:
XLY performance in August has hurt the Elev8 portfolio vs. its SPY benchmark, but it falls short of our bullish reversal threshold at $188. See the chart below. Note the relative performance vs. the S&P 500 is still in a longer-term downtrend over the past 12 months.
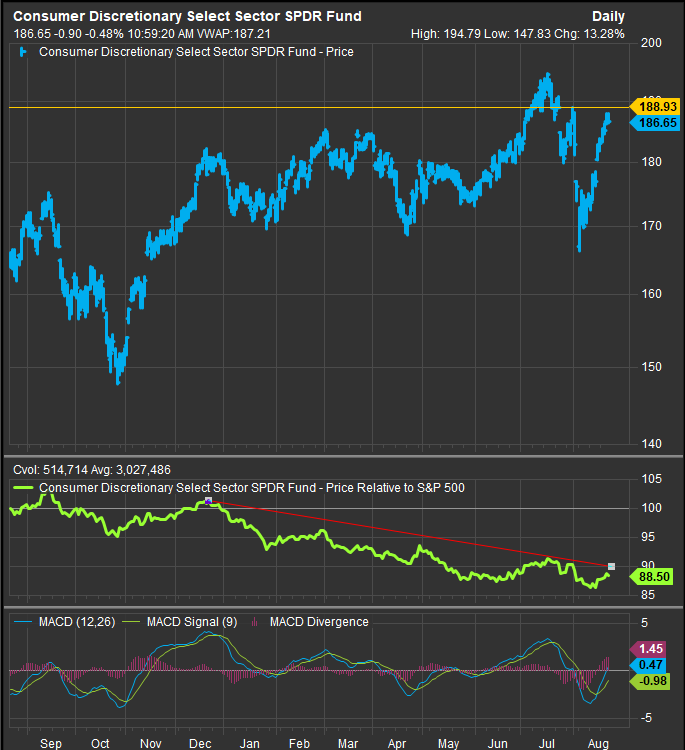
- XLY daily, 1 year (Relative to S&P 500 | 12, 26, 9 MACD)
- Still short of breaking through overhead resistance at $188.93, we are maintaining our short at this time
While not being in the XLY has hurt the portfolio so far this month, we have been on the right side of the commodities trade with short positions in XLE and XLB. The Bloomberg Commodities Index (chart below) continues to show price weakness as the recent “dead cat” bounce off of the 93 level reinforces.

- Bloomberg Commodities Index daily, 1 year (200-day moving average | 12, 26, 9 MACD)
Data sourced from FactSet Data Systems
