


Price Action & Performance
The S&P 500 was positive for August with a sharp rebound after a 10% correction into August 3rd.
The S&P 500 traded to an all-time high of 5667 on July 16, 2024. It sits less than 1% below that level as the investment industry returns from summer vacation. The last week has seen a tight consolidation as Mega Cap. darling NVDA posted solid but underwhelming earnings while expectations have firmed for the Fed to cut rates in September.
Oscillator work at the Index level is in the middle of the range, neither overbought nor oversold. At the sector level, the YTD leadership is comprised of XLF and XLC which are the only sectors outperforming the benchmark. In the past 2 months, Min vol. sectors and XLF have outperformed while Discretionary, Technology and Energy Sectors have been the weakest performers in the near-term.
Since July 1, the S&P 500 has lagged the Russell 2000 and the Russell Mid-Cap. indices, but has remained an outperformer vs. ACWI.
We think the bull trend can continue, but we also think the election year setup is ripe for consolidation after strong YTD performance. That being the case we are keeping our bets +on the smaller side with most sector level positions within +/- 4% of the benchmark weights.
Economic and Policy Drivers
Interest rate policy projections will continue to be critical to positioning. For now, the expectation for lower rates has spurred bets on laggard industries and Sectors. Real Estate, Financials, Energy and Materials Sectors have accrued gains against this backdrop as lower rates are projected to spur marginal improvement in the Economy and lessen the probability of contraction. On the other hand, Utilities and Healthcare have also benefitted as the historical beneficiaries of lower rates and more conservative investor positioning.
High level concerns for the equity market include a flagging consumer. Rates have been arrested to the upside, but they are still far higher than pre-covid levels. The S&P 500 Homebuilders Industry rocketed higher in July on expectations that rate cuts will help home affordability, but many other industries within the Discretionary Sector have failed to sustain any level of outperformance. It will be interesting to monitor the interplay between equities and rates moving forward. We wonder how low rates can go if they spark a positive turn around in consumer fundamentals and lending. Typically, if those two things firm, rates move higher on their own.
Politics and Policy will factor into positioning over the next month. Bets on a second Trump Administration would likely involve going long the Energy Sector and Materials Sector as regulatory burdens would likely be eased. The Republican party is typically perceived as being more business friendly, but their likely immigration and foreign policy platforms (Withdrawal from NATO/Restrict Immigration) are potentially very inflationary. The view here is that the three main drivers of inflation going forward will be economic policy towards China (Donald Trump’s sanctions on China pre-covid and the subsequent dis-integration of the previous global supply chain paradigm were a driver of the current inflation we feel), over-restriction of immigration, and the other is the vast and growing wealth inequality that exists in this country. We think policy that addresses China relations, immigration and reforms the tax code would be the most important topics to watch as far as how they will affect the stock market. We can expect policy positions to be staked out in more detail as the election approaches.
In Conclusion
As trend following investors, we have shorted the weakest sector in each of three broad categories within the S&P 500 in our Elev8 sector rotation model. Among commodities linked Sectors we are short XLE and XLB as their performance historically is highly correlated to commodities prices. The commodities price trend is the weakest observed trend among our big 4 macro indicators. We are short XLP as the weakest defensive sector, and we are tactically short XLY as the weakest historical upside exposure. Given equities rotation away from Mega Cap. Growth in the near-term, we start September at a pivot. XLK has given back all of its previous YTD outperformance to the benefit a broad array of sectors. We think we’ve identified XLF as the next leadership sector, but we will also continue to give the benefit of the doubt to XLK and XLC at present.
Chart | S&P 500 Technicals
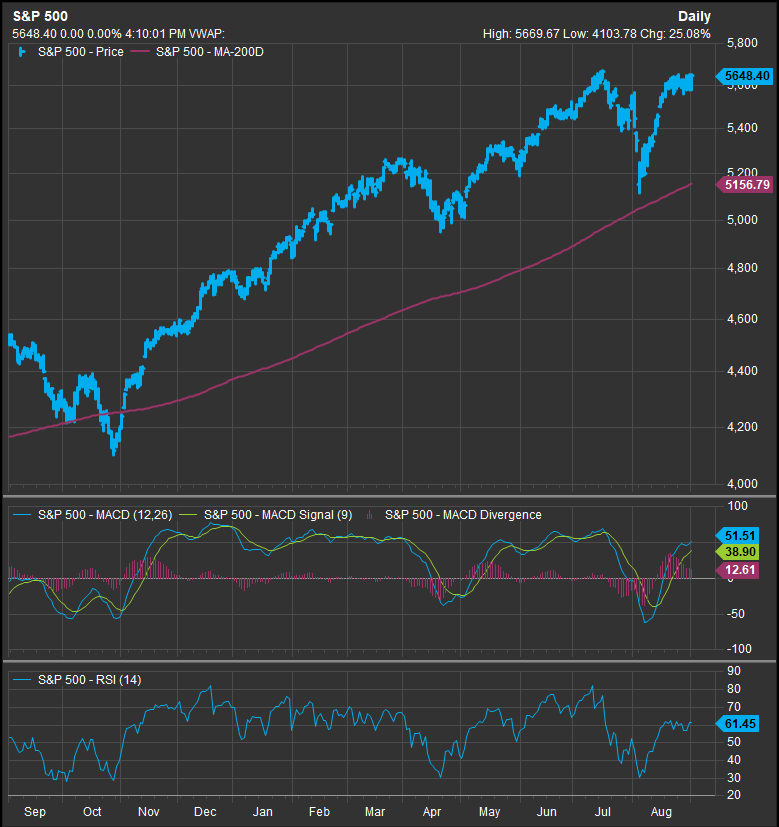
S&P 500 12-month, daily price (200-day m.a.|14-day RSI|12, 26, 9 MACD)
- S&P 500 is on the cusp of new all-time highs
- Since XLK gave up leadership in July, XLF and historically low vol. sectors have had the edge over commodities plays and we are positioned for that to continue in September
Sector SPDR Relative Performance to S&P 500 | 1yr
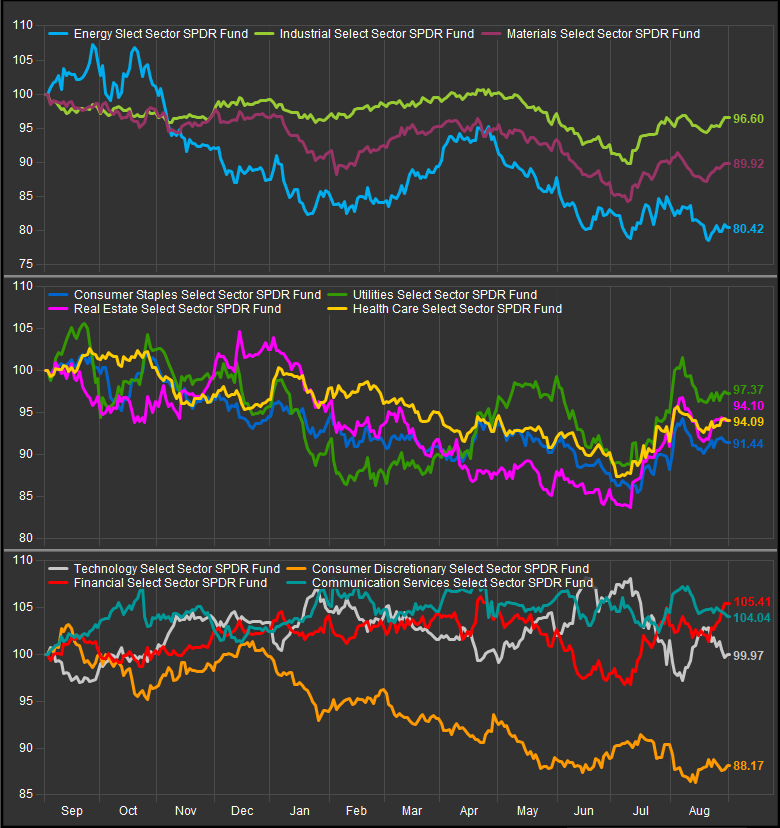
- When in doubt, we prefer strength over weakness against the backdrop of a longer-term bull market
