Our Tactical sector report looks at price action and options market indicators to evaluate potential near-term dislocations in price. The table below covers the large cap. US Sector Fund Families from SPDR’s, iShares and Vanguard.
Over the past month we’ve seen rotation away from min vol. sectors which had dominated the preceding 3 and 6-month timeframes. Energy, Discretionary, Comm. Services and Technology Sectors have taken up leadership near-term, while Industrials and Financials have been the steadiest performers.
We are adding another component for consideration in our tactical report. We want to highlight the distance away from a moving average as a proxy for trend dislocation. The tables that follow show the Sector ETF’s with their trailing returns and their calculated difference from an exponentially smoothed 200-day moving average or EMA. This is traditionally more of a stock level gage rather than for use with broad funds, so we will be showing the most overbought and oversold stocks here as well to see if we can get some clues as to which areas of the market are most likely to see accumulation and profit taking based on intermediate dislocations vs. trend.
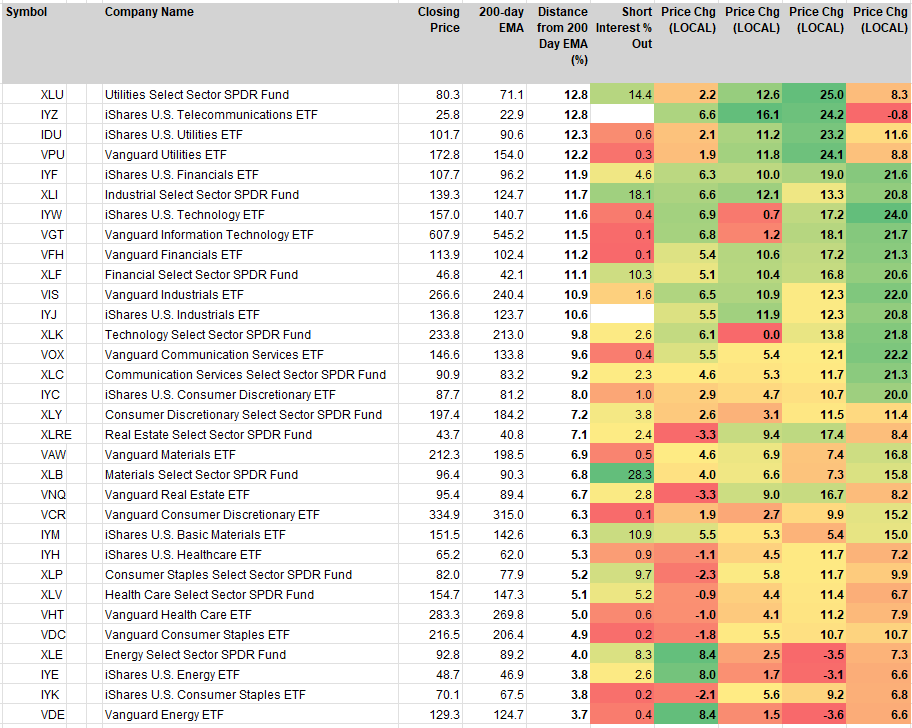
Sector Fund Families: Distance from 200-day EMA
We can see in the table below that Utilities continue to be the most overbought relative to the 200-day trend while Staples and Energy are the closest to average. Short Interest % is at its highest for Energy, Materials and Industrials Sectors showing the skepticism equity investors have for the recent rally in Crude and Commodities prices. We share that concern.
S&P 500 Most Overbought Stocks: Distance from 200-day EMA
This technique is useful for overbought stocks. Historically we have observed that >20% above the 200-day smoothing is a point where stocks tend to consolidate or mean-revert. We tend to give more slack to Growth stocks in this measure and start watching them closely at >30% above. Here are all stocks in the S&P 500 that are >25% above their 200-day EMA’s.

This is an important screen and a challenging one for investors like us with a trend following approach. We want to let momentum run as it is our alpha production source, but we want to also lighten up our positioning ahead of potential corrections. As you can see, many of the most overbought stocks at present are buy-rated in our work. We are ok with this, what we are looking for to get more cautious is a broadening out of this list. If too many similar co.’s get too far above or below trend, that’s where rotation is most likely. Right now what keeps us constructive as a sector investor is how few names are on this list.
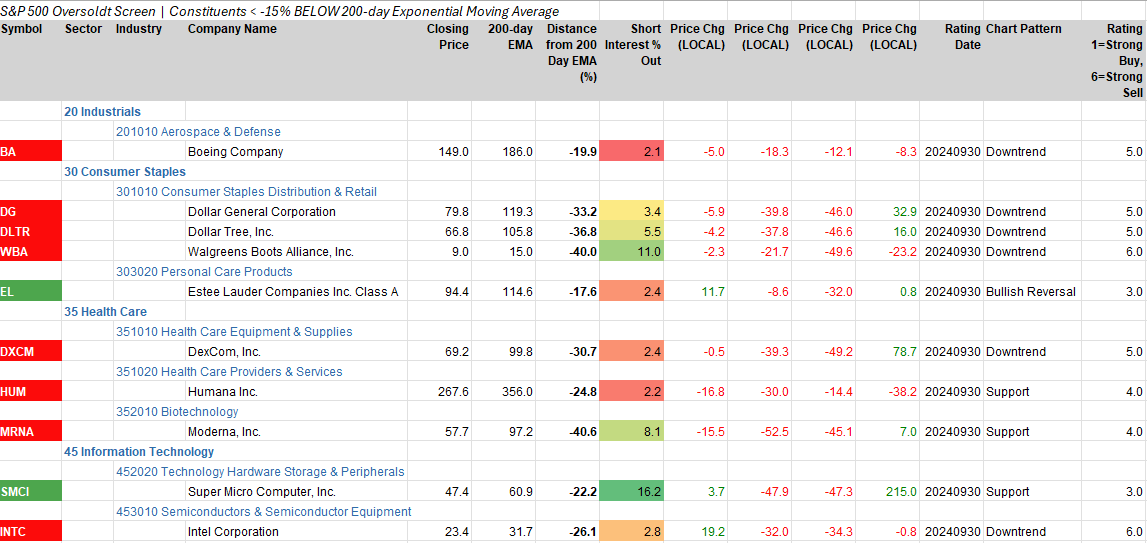
S&P 500 Most Oversold Stocks: Distance from 200-day EMA
On the oversold side we see the opposite dynamic where the trend following process disdains oversold stocks. Here we are willing to bet on EL and SMCI to work, despite near term, downside dislocation. EL improves in our work due to positive developments out of EM. Personal Products are very positively correlated to EM equity performance. SMCI has been an intermediate-term bearish retracement in a strong longer-term uptrend. We think there is potential for accumulation there.

Conclusion
With equities making several new highs in September and October we are seeing rotation away from safety and skepticism that commodities can continue to rally from here. This continues to have us positioned for a Growth led bull market based on our trend following indicators. We like Discretionary, Financials, Information Technology, Comm Services and Industrials as our largest OW positions at present.
Data sourced from FactSet Research Systems Inc.

