ETF Insights| November 1, 2024 | Healthcare Sector
Price Action & Performance
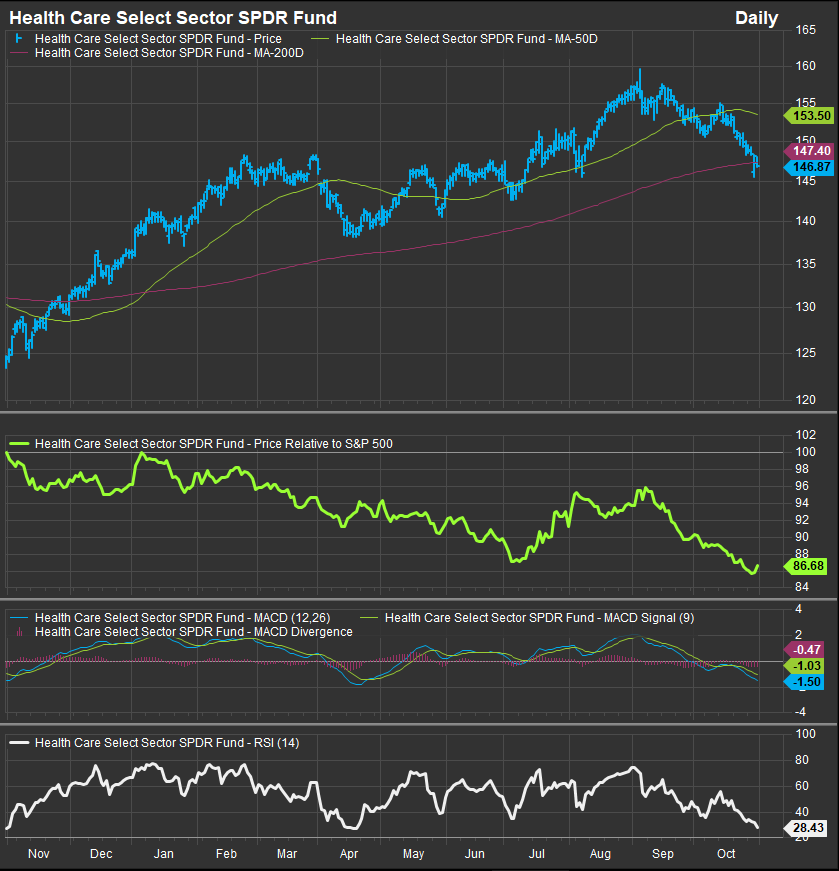
In absolute terms, XLV declined 5% in October and lagged the S&P 500 by a similar amount as the worst performing sector on a total return basis. The sector now sits at a clear oversold condition, but our indicators and our individual stock level work still signal a pessimistic outlook for the sector.
Healthcare Sector and Industry level performance vs. the S&P 500 has been weak with the exception of the HC Equipment & Supplies industry which has outperformed over the past 3 months. Pharma, Biotech, Providers and Life Sciences Industries have all been laggards and we aren’t seeing the types of positive momentum divergences we’d want to see at the sector, industry or stock level to bet on a turnaround this month.
Unsurprisingly, the correction in prices at the sector level has been accompanied by deteriorating stock level technical. REGN, for example, broke lower on a poor quarter after entering the month as one of the strongest charts in the sector in September and VRTX followed suit in October. Our list of buy-rated stocks in the sector continues to get winnowed down by poor performance. Our buy list includes BSX, COO, ISRG, RMD, SOLV, ABBV, INCY, VRTX, BMY and LLY.
Economic and Policy Drivers
The emergence of GLP1 drugs has had a profound impact on the Healthcare sector. However, after 2+ years of dominance by manufacturers like LLY. While LLY is retracing a portion of its YTD gains in the near-term we haven’t seen any areas of the sector that are filling the leadership vacuum it creates.
Beyond GLP1 drugs, we haven’t seen any new themes motivating the space which, in the past, has enjoyed boosts from Obamacare, Biotech, and in 2022 a bear market that motivated investors to seek lower vol. equities.
In Conclusion
We enter November with Healthcare as one of our three zero-weight sectors. Our Elev8 Sector Model is UNDERWEIGHT the Healthcare sector with a -11.02% allocation vs. our benchmark S&P 500
Chart | XLV Technicals
- XLV 12-month, daily price (200-day m.a. | Relative to S&P 500 | MACD | RSI)
- Finally seeing some evidence of bullish reversal on the chart, still not totally convinced
XLV Relative Performance | XLV Industry Level Relative Performance | T3m

Data sourced from FactSet Research Systems Inc.

