
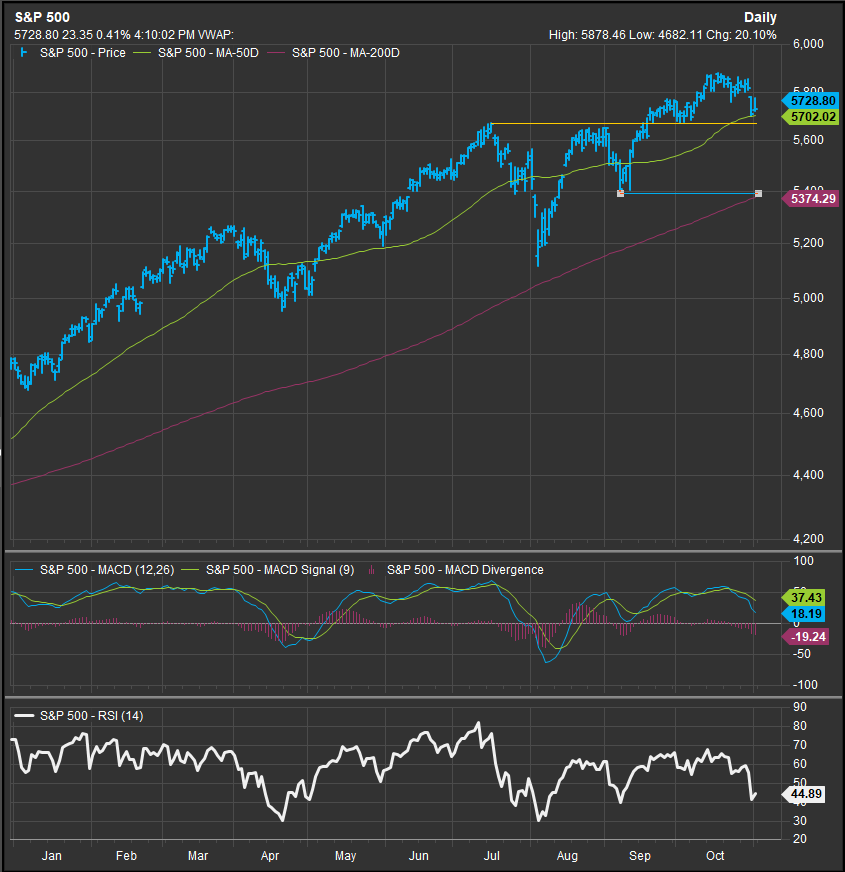
The S&P 500 ended lower for a second consecutive week and now sits at near-term support. The oscillator work on the chart below shows a short-term sell signal on the MACD and the RSI attempting to turn higher near levels that market an oversold turn in September. The catalysts have been strong but underwhelming Tech. Sector earnings, higher interest rates in the near-term, and contractionary manufacturing survey readings. With the inherent uncertainty of the looming presidential election, there has been a clear profit-taking motive among investors. Despite the inclination to pessimism that comes with lower prices, the intermediate-term chart pattern for the S&P 500 remains bullish with a price target above 6100 that projects for the 1st half of 2025.
The chart below shows our max. draw down projection for any near-term volatility is just above the level of the 200-day moving average at 5389. We think the biggest threat to the bull market is high rates as it could stifle consumer spending and freeze up the housing market to the point where production becomes crimped.
The US 10yr Yield has broken out above resistance at the 4.30% level against our expectations. The next significant horizontal resistance level is 4.50%. We’re skeptical of the move higher in yields at this point though we are concerned about its impact to scuttle the equity uptrend.
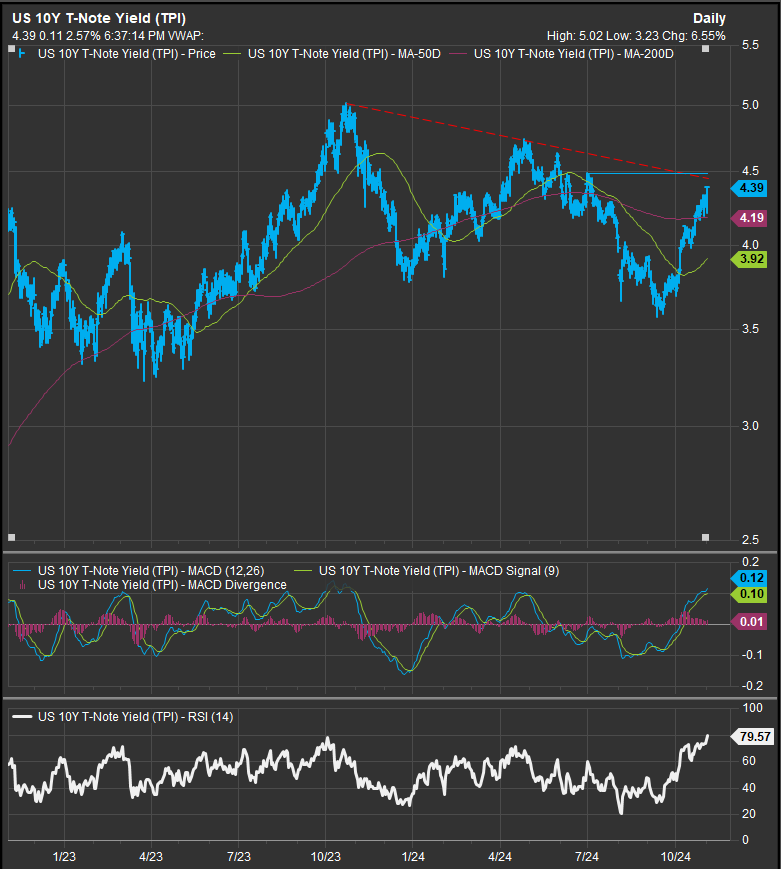
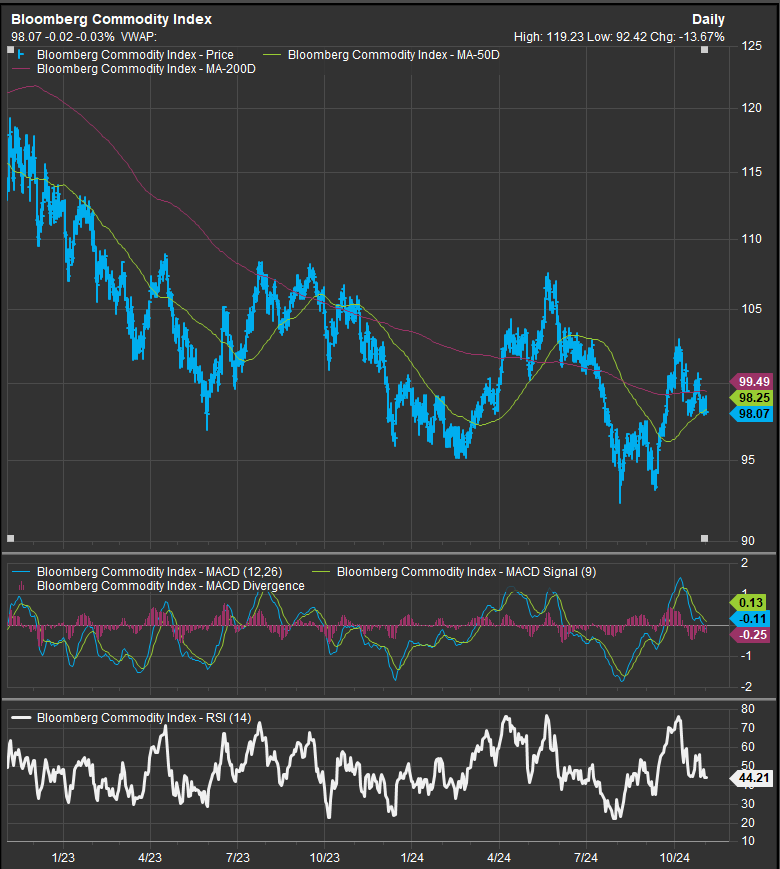
Our skepticism derives from the weak price action of Crude and Commodities prices (the latter chart is below). This, along with weaker manufacturing data and slightly cooler employment number, is not a backdrop for rapidly rising rates. The oscillator work on the chart shows a clear overbought condition and the MACD is at a level where reversals occurred in the past. This combination makes us think rats will be walking back down sooner rather than later. The Bloomberg Commodities Index price chart (below) has moved back below the 100 level. The two-year price chart shows prices still >20% below where they were at the start of 2023.
With the Fed guiding lower, manufacturing readings weak, commodities prices soggy and Tech Sector earnings underwhelming, why are rates marching higher so quickly?
–Patrick Torbert, CMT | Chief Strategist, ETFsector.com
Sector ETF’s/The Week in Review
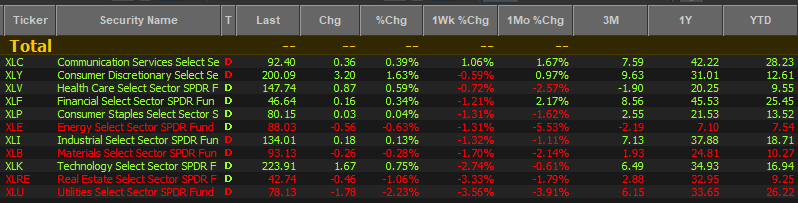
Sector leadership was an interesting mix last week given the context of a bearish tape at the index level. Comm. Services was the only positive sector for the week, powered higher by strong results from GOOG/L and META. The Sector is now the top performer YTD and trails only Financials over the past 12-months.
Higher rates led to rotation on the defensive side of the sector spectrum. Utilities and Real Estate suffered while Healthcare and Staples, which had been laggards for most October fared better. Technology shares gave back recent gains on lackluster reports from MSFT, AAPL and some key semiconductor names.
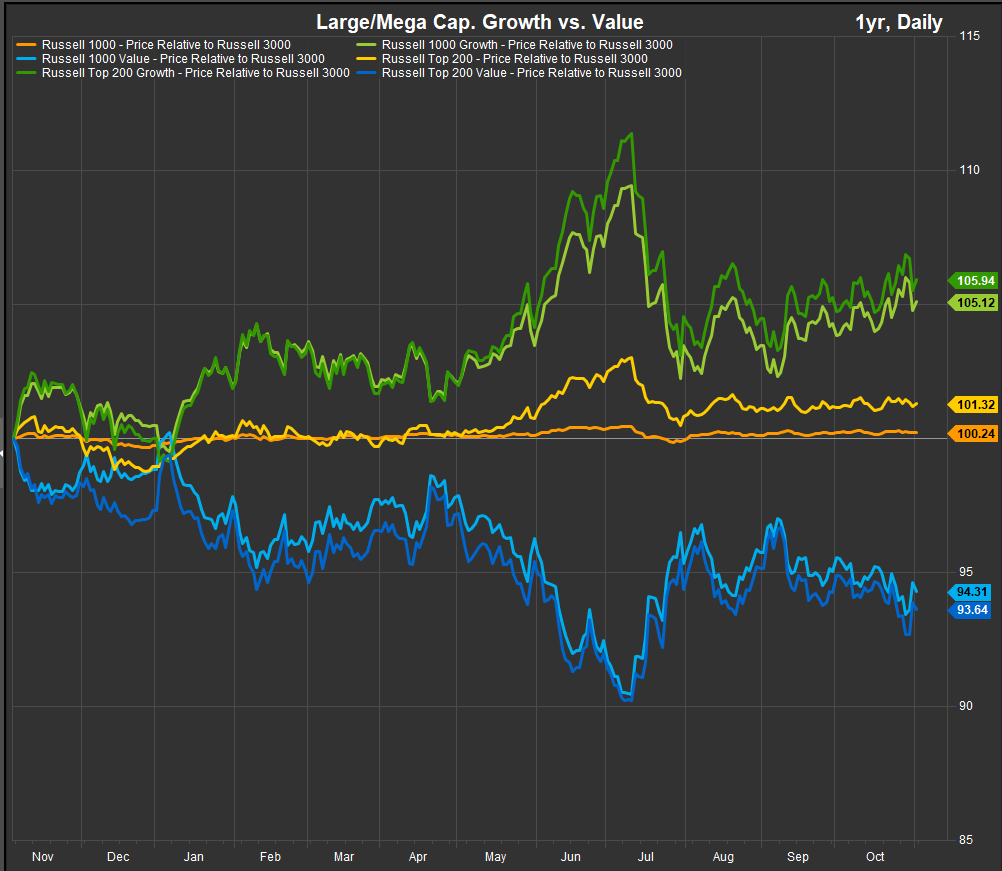
Despite rates backing up, Growth has held its own vs. value over the past two months though we can see a big retracement in performance from July through August dominates the style chart below.
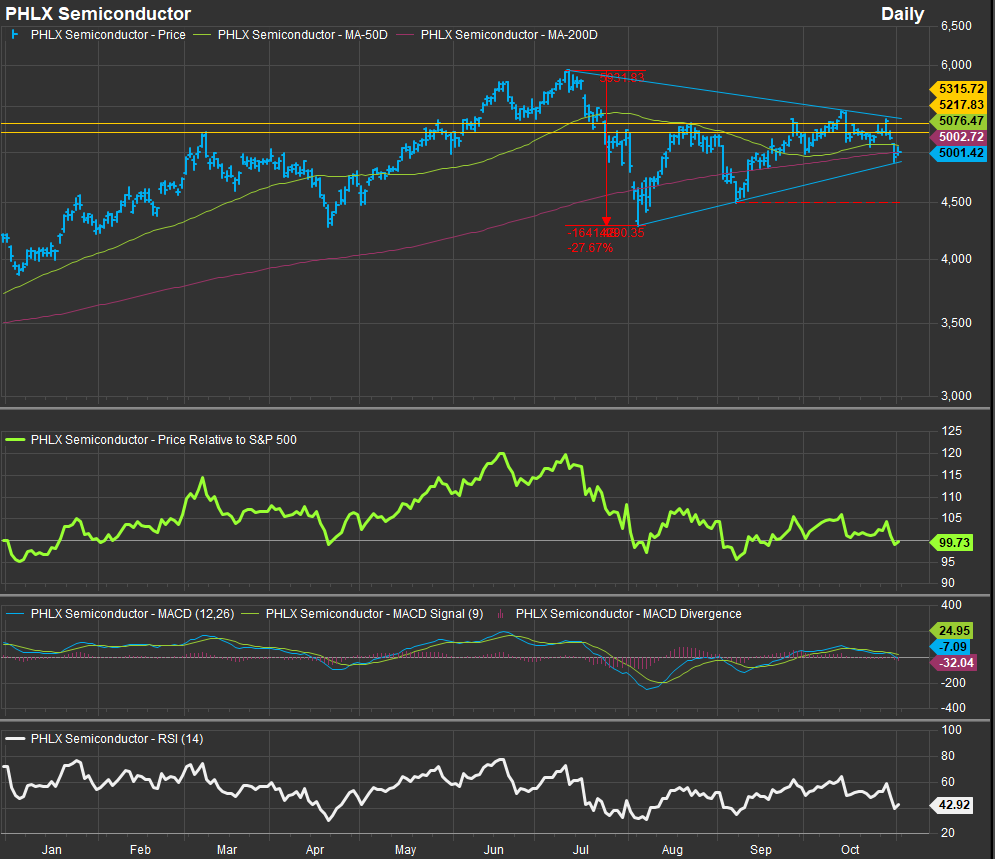
What has been notable is the shift in leadership as NVDA has finally shown some loss of momentum and Semiconductors in general are looking a bit toppy. Could we be seeing the equity leadership transition from AI providers to AI implementors? Or are we just taking a pause in the capital cycle with no paradigm shifting benefits accrued despite all the hype? That’s really distilling it to a binary, but in the meantime, the results and the price action are concerning for the SOX Index and we think if this does prove to be a deeper pause for Semiconductors it is an opportunity for other groups of stocks to attract capital. On the chart below, the SOX is forming a multi-month wedge pattern. A break-down implies potential for a material correction below the August lows. The technical position improves above the 5315 level. This is an Index on the ropes. It has been powerful longer-term trend, so we have maintained a small bullish exposure in our sector portfolio, but we are watching this closely as November gets underway.
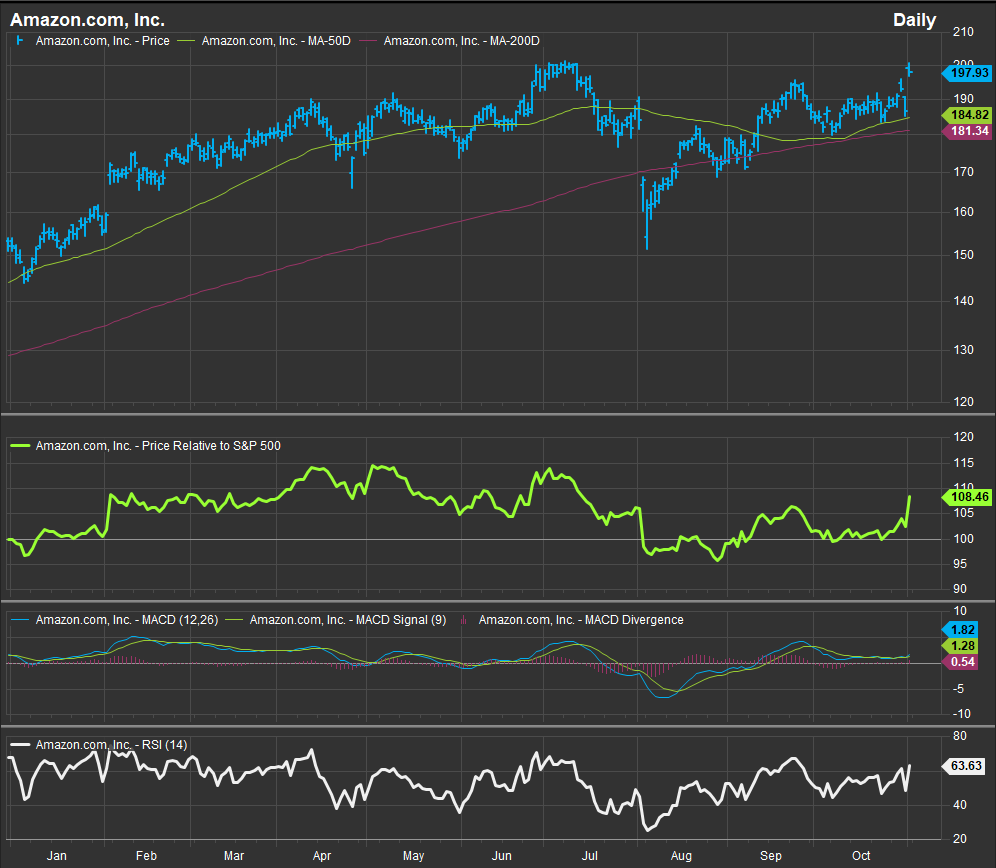
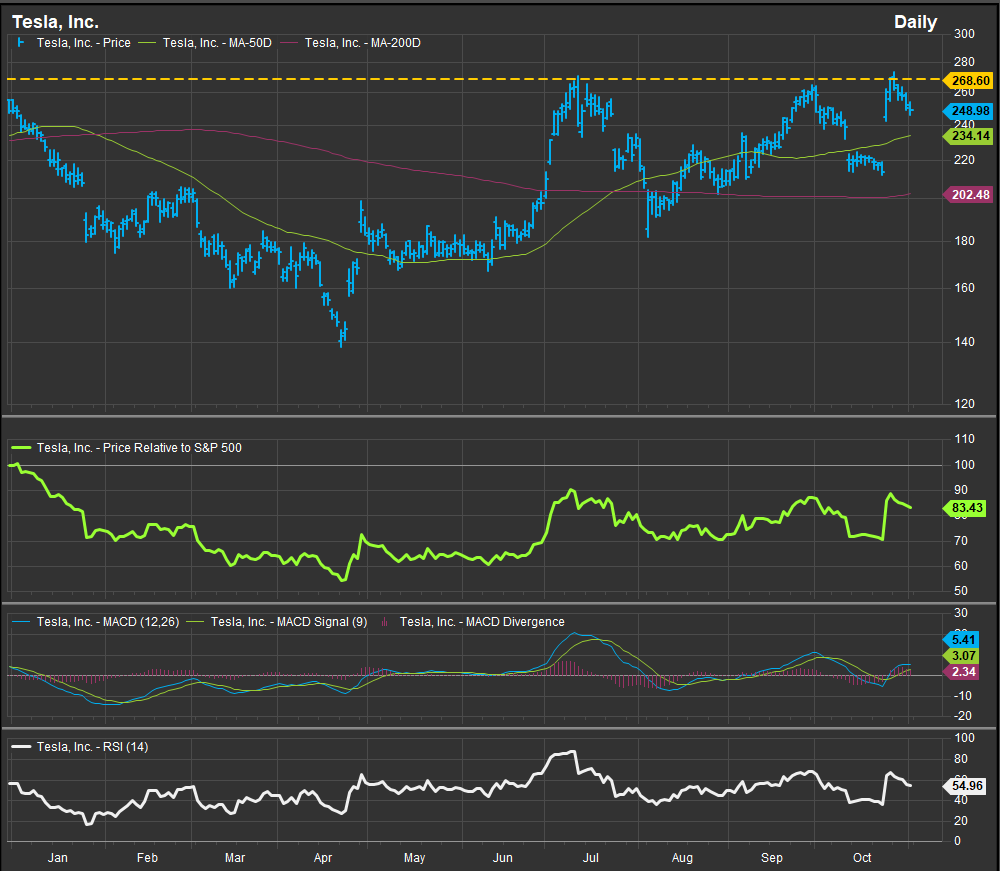
AMZN, GOOG, TSLA Charts are Improving.
Semiconductors are getting some negative press in the near-term, but AMZN and TSLA posted strong quarters and GOOG/L and META did as well. The key for trend investors is always follow through. Is there momentum behind these revelations? AMZN would throw off a price target of $250 with a move above $201. We like that as signal.
TSLA continues to flirt with the $270 level which we ID’d in last week’s letter as significant.
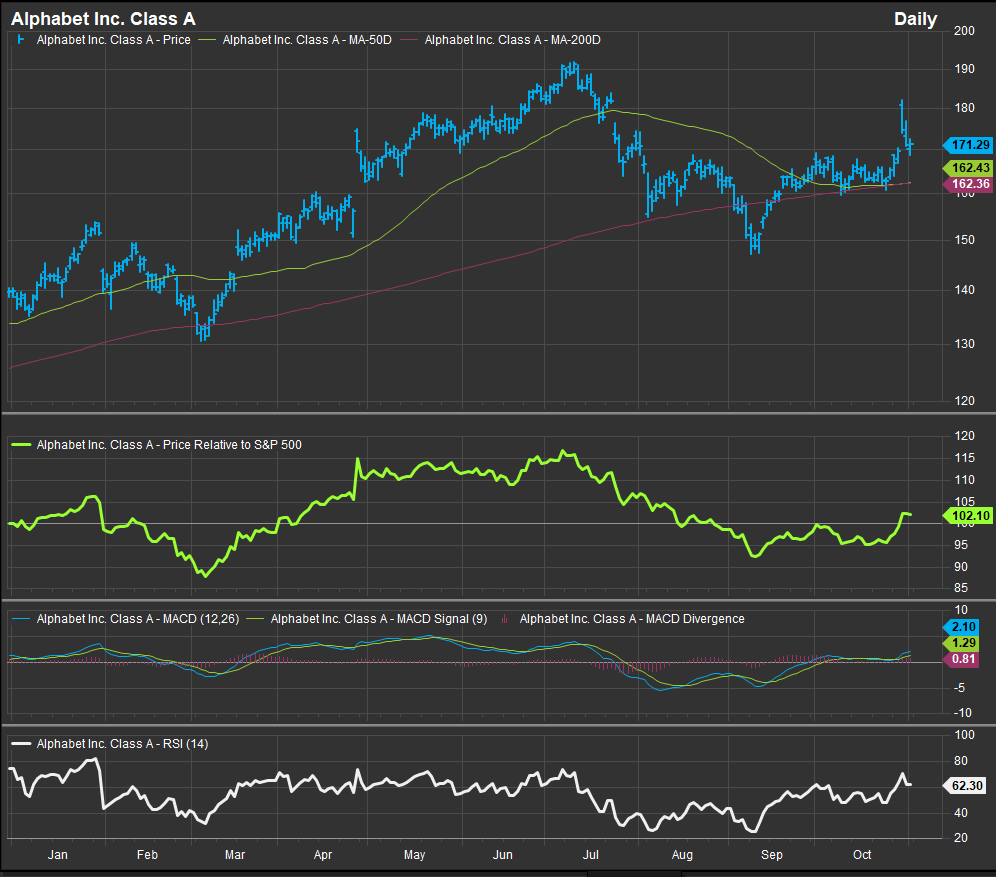
GOOG broke out to the upside and established a new bullish reversal pattern off its July-September correction.
As a parting thought, we’d say that if rates do continue marching relentlessly higher things will end badly, but we have outlined as concisely as we can why we are skeptical. On the other hand, despite some weakness in Tech and Semiconductors which had been an important leadership theme, many Growth heavyweights remain attractive here. The Mag7 is dead, long live the Mag7.
We encourage everyone to vote on Tuesday!!
Data sourced from Factset Research Systems Inc.
