
We take our first broad look around the globe in 2025. Despite some initial softness in domestic equity markets to start the year, there hasn’t been too much to get excited about in the ex-US space. We’ve seen some near-term strength from the MSCI EAFE Index, and we think there’s potential for some follow-through there, but the benefit of the doubt has to remain with US equities for now.
We think paying attention to equal weighted stocks vs. cap. weighted is likely to be a tell. The chart below shows the S&P Equal Weighted Index relative to the standard cap. weighted version. This is the first time since July of 2024 that we’ve had a sustained period of outperformance for the average stock and both periods saw cap. weighted S&P 500 move lower. This shouldn’t be surprising as Mega Cap. Growth/Mag7 has been a core driver of the S&P 500’s excess returns over the last 2 years. Europe in particular does not have a cohort of Mega Cap. stocks to rival these, and China hasn’t been interested in cultivating the market performance of its Tech behemoths. As a result, a headwind to mega-caps not only lifts equal weighted US stocks, but it also has potential to lift ex-US stocks. Put a different way, when mega cap stocks outperform, the average stock typically performs like a below average stock. Ex-US equities have fallen prey to this dynamic as well, but now, with the average stock ascendant in the near-term, we judge there is a higher potential for ex-US stocks to outperform as well.
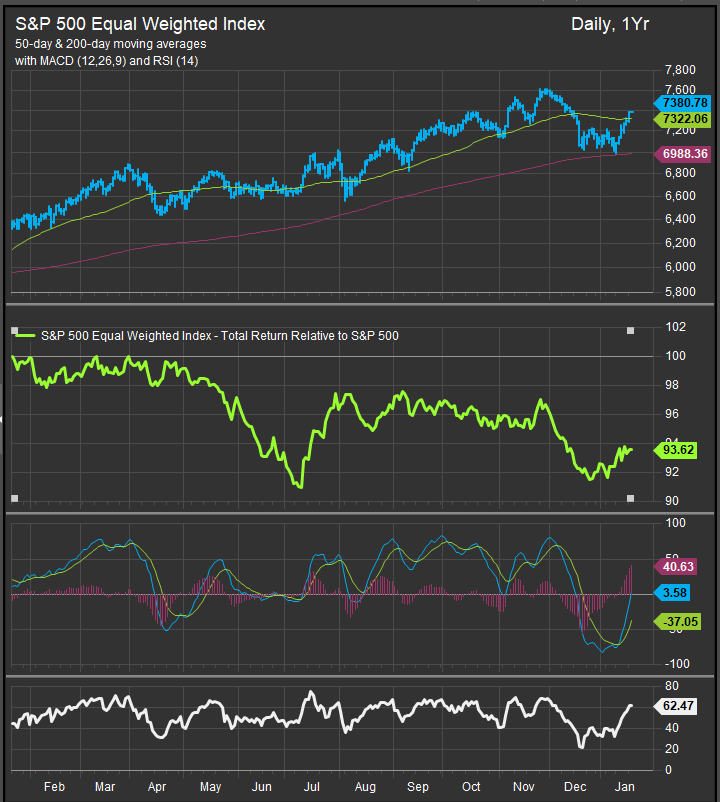
US Stocks showing Bullish Reversal vs. MSCI World Index
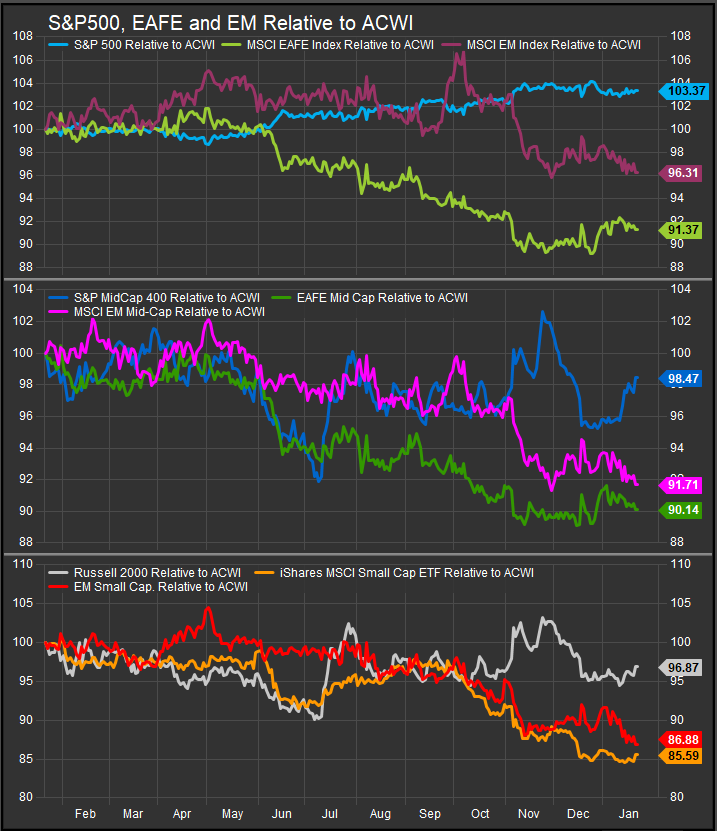
The chart below shows US, EM and DM headline indices relative to the MSCI World Index for Large, Mid and Small Cap. stocks. Within each market cap. tier, US equities are leadership. We note that EAFE large cap. stocks have firmed coincident with end of December weakness in the US. However, with optimism returning to the US equity market that transition is on hold.
The other observation to make is that S&P 500 outperformance has plateaued since November and this loss of momentum opens the door to leadership rotation. We think rates would need to stay elevated to affect such a shift, so we should keep watching the US 10yr Yield chart to see if rates maintain above support at the 4.5% level.
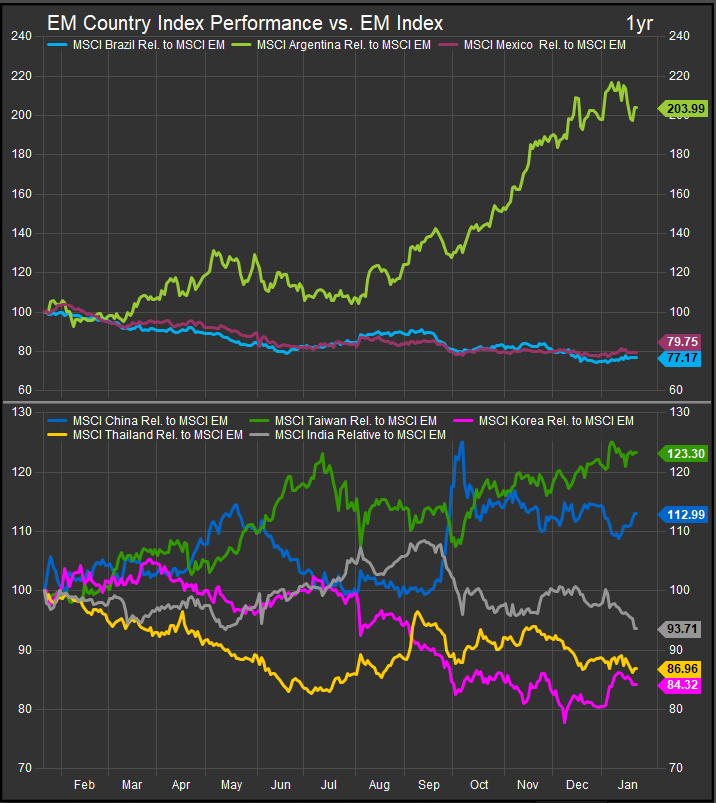
EM Country Performance
Taiwanese and Argentine shares continue to be the top performers in the near-term and over the past 12 months (chart below). The run up in Argentine shares has been nothing short of impressive and everytime we pull up the chart it seems they’ve made significant new gains. The MSCI Argentina Index has outperformed the MSCI EM index by 103% over the past 12-months outpacing regional counterparts. China continues to retrace its October gains lower, and with the relative curve now moving below the May relative-high, its potential bullish reversal from October is called into question.
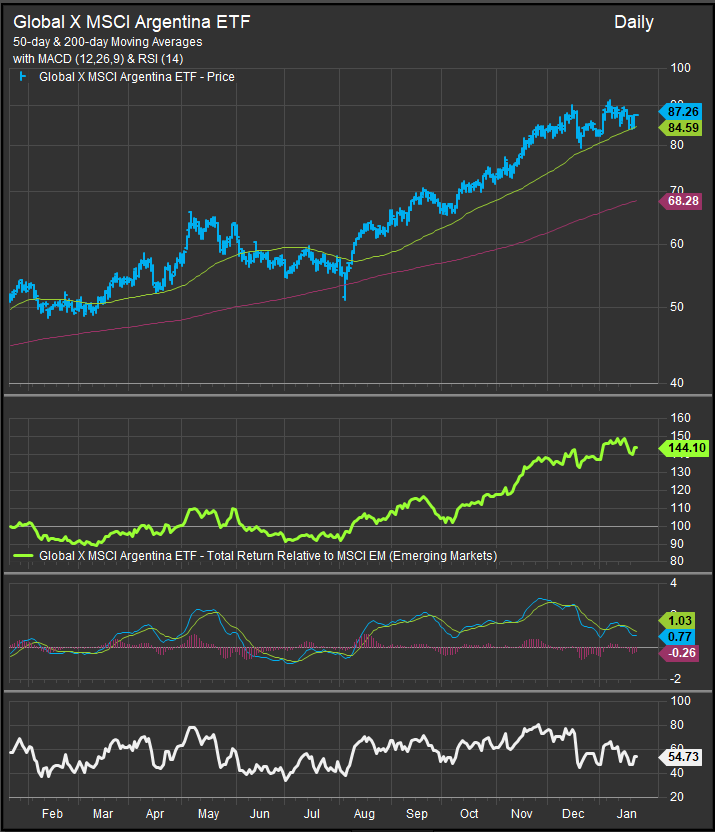
The Global X MSCI Argentina ETF (chart below) has 11 constituents with MELI accounting for >80% of the market cap., but there are several other strong performers including CAAP, DESP, SSR Mining Inc. in the near-term and Cencosud S.A. which is breaking out to new multi-year highs. Its shares have outperformed by 44% this year vs. the MSCI EM Index benchmark.
DM Equities Are Starting to Differentiate by Country Performance
DM equities in aggregate have lagged the MSCI World benchmark by just less than 9% over the past 12 months. But we are starting to see clear winners and losers among country constituents.
In core Europe, German shares have distinguished themselves as leadership (chart below, top panel) while the 3 other core country indices have begun to firm in the near-term. Asia/Pacific countries in the EAFE universe (middle panel) have generally been in consolidation since November with China having fully retraced gains from September/October.
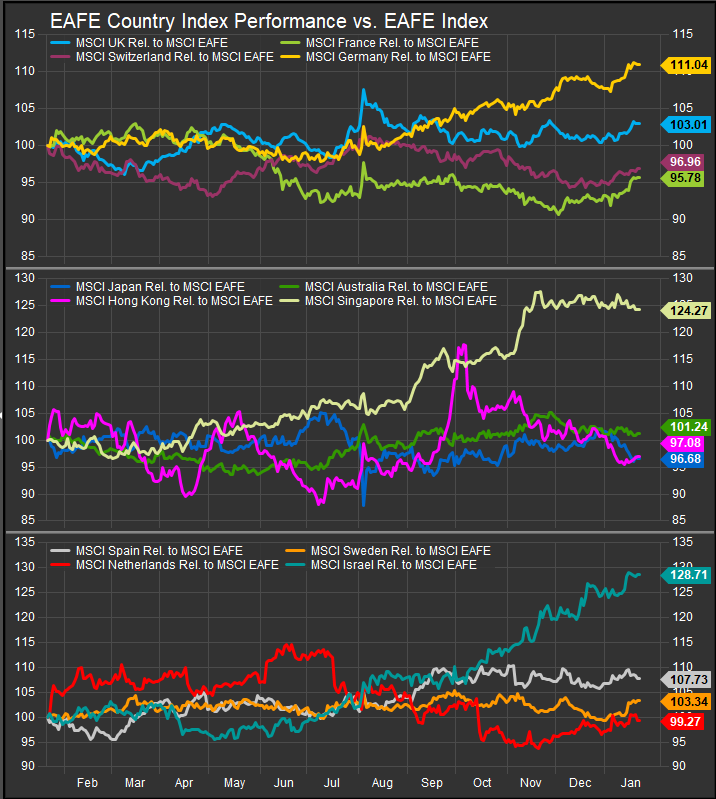
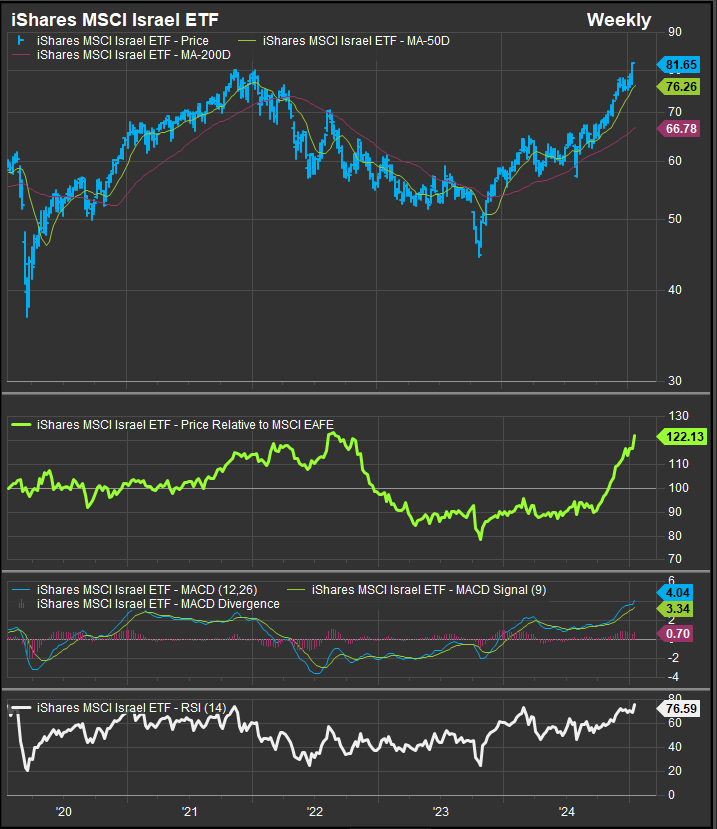
Israeli shares continue to trend higher which is transpiring in the context of a longer-term bear-to-bull reversal for the index. Unsurprisingly, October of 2023 was a long-term market low for Israel and after some month of basing, stocks there are on a strong recovery and recently broke out to new all-time highs which were previously registered in 2021. See the chart below. While we would expect some consolidation, what is on the chart is a long-term buy signal for us with the weekly RSI study well above 70 confirming sustained buying power. We would be interested in accumulating Israeli shares on a pullback.
Conclusion
Ex-US equities continue to lag at the aggregate level, but there are clear pockets of strength in some international geographies. Argentina, Israel and Singapore are showing outperformance trends worth getting excited about. China has faded, but Germany is starting to gain some positive momentm and other core European countries are perking up in the near-term as well.
From a macro perspective we think higher rates would continue to benefit the average stock and that would open the door for more sustained outperformance from ex-US equities.
Data sourced from FactSet Research Systems Inc.
