
February 23, 2025
The bullish trend for US equities matured in 2024 and is showing signs of fatigue to begin 2025. We are seeing several negative momentum divergences across important market bellwethers from the Mag7 to Housing to the S&P 500 itself. US equities are losing momentum to the upside and investors are starting to look elsewhere with their speculative allocations.
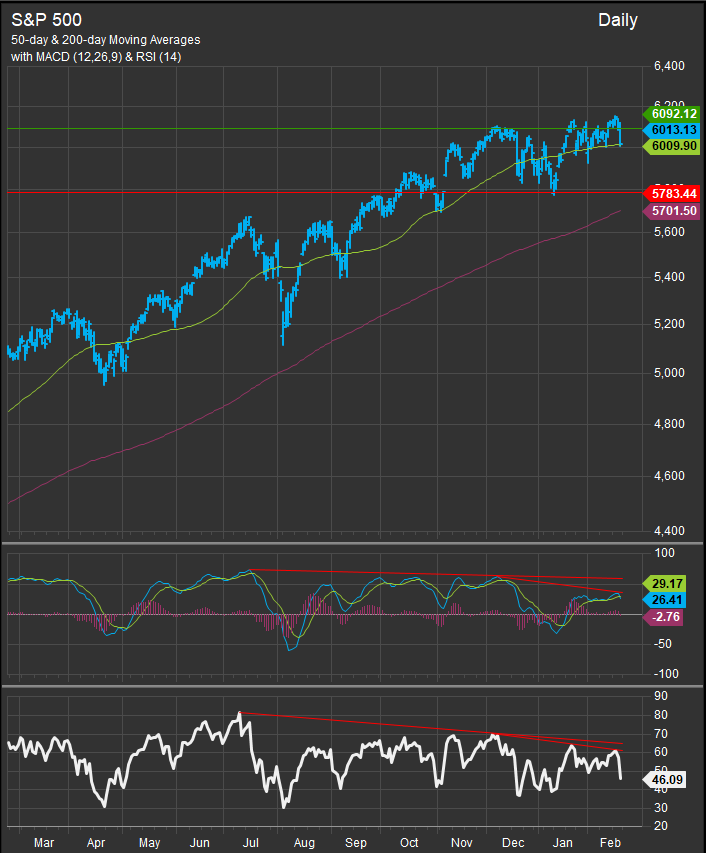
S&P 500 Showing Negative Momentum Divergence over the Short and Long term
The S&P 500 (chart below) remains in a long-term uptrend price structure, but our momentum gages, the MACD and RSI oscillators in panels 2 and 3 of the chart have been peaking at lower levels over the preceding 6 and 12-month periods. This, in the technical analysis parlance, is a negative momentum divergence and it signals that buying power in the marketplace is weakening.
Mid and Small Cap. stocks have already rolled over on performance vs. the S&P 500. When we look at sector performance over the past 3-months we can see the erosion of enthusiasm 2024’s best performing sectors. Discretionary stocks have been sold hard over the past 2 months. Defensive sectors caught a bid at the end of last week, and only 2 sectors have outperformed since late November (Comm. Services & Healthcare). Prior to last week’s bearish ending, stocks had been in a holding pattern near their highs.
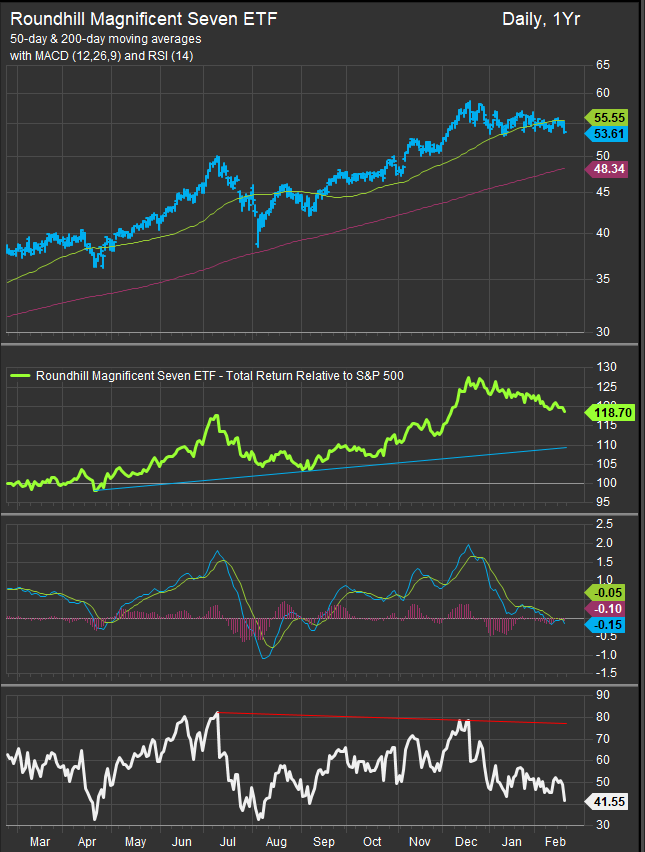
As one can probably figure from the sector performance chart as a whole, the Mag7 has been in consolidation and hasn’t been a driver of outperformance since November as the chart below of the Roundhill Mag7 ETF demonstrates.
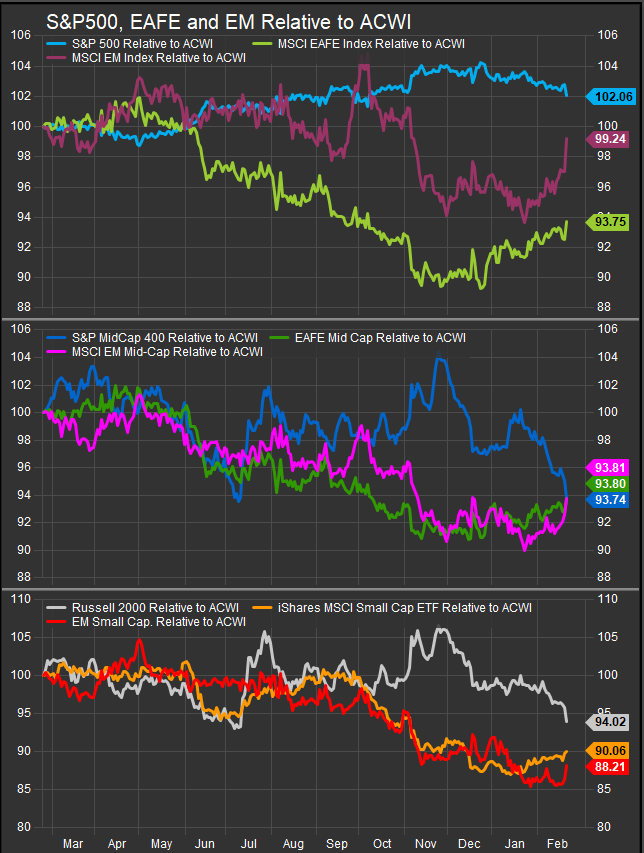
Global Equities Outperforming in the Near-term
While US equities consolidate, ex-US equities have begun outperforming over the past 3-months. The chart below shows US, EAFE and EM indices vs. ACWI for Large, Mid and Small-Cap. tiers. EAFE and now EM have firmed at the expense of US shares.
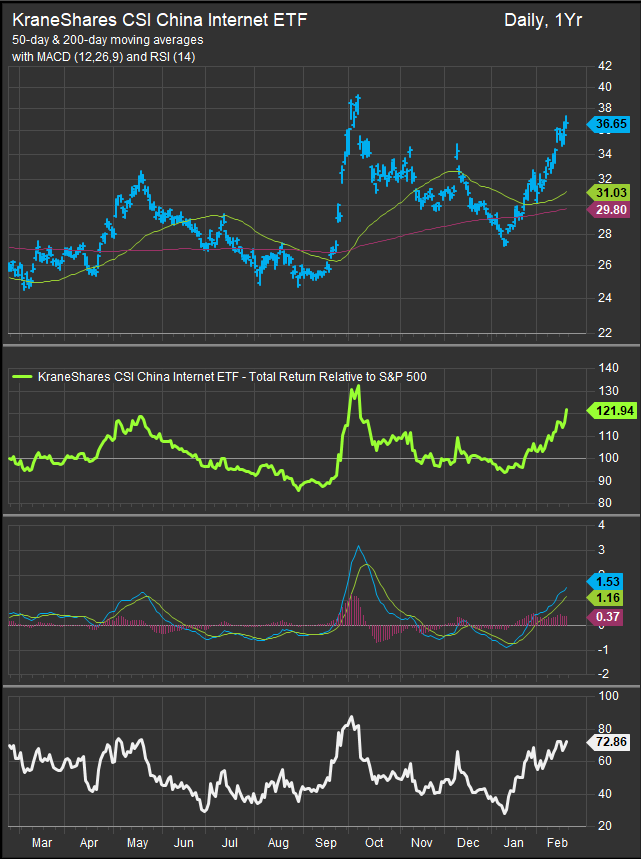
What has been attracting bids in the near-term is Chinese internet companies. The KWEB Chinese Internet ETF is near highs for the year as Tencent and Alibaba have come back into vogue on the speculative side (chart below).
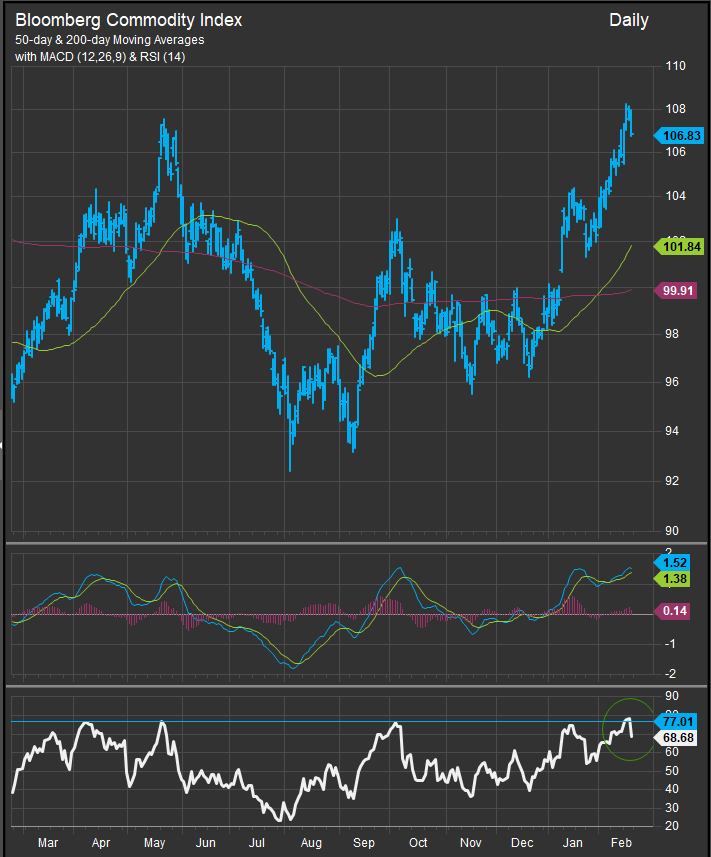
Commodities Prices Trading into Longer-Term Resistance
Tariff implementation has led to rising commodities prices in the near-term. With Energy sector performance among the weakest of the bull cycle since early 2023, there is potential for the sector to reflate in the near-term and we some improvement in the stock charts at this point. Materials stocks have also been neglected for much of the past two years and could see some fresh buying interest based on the Commodities price action and their technical setup. The chart below shows the Bloomberg Commodities index pulling back from resistance at the 108 level.
This is one index that is not showing a negative momentum divergence with the RSI study out to fresh cycle 6-month highs on the recent upwards move (chart below, bottom panel).
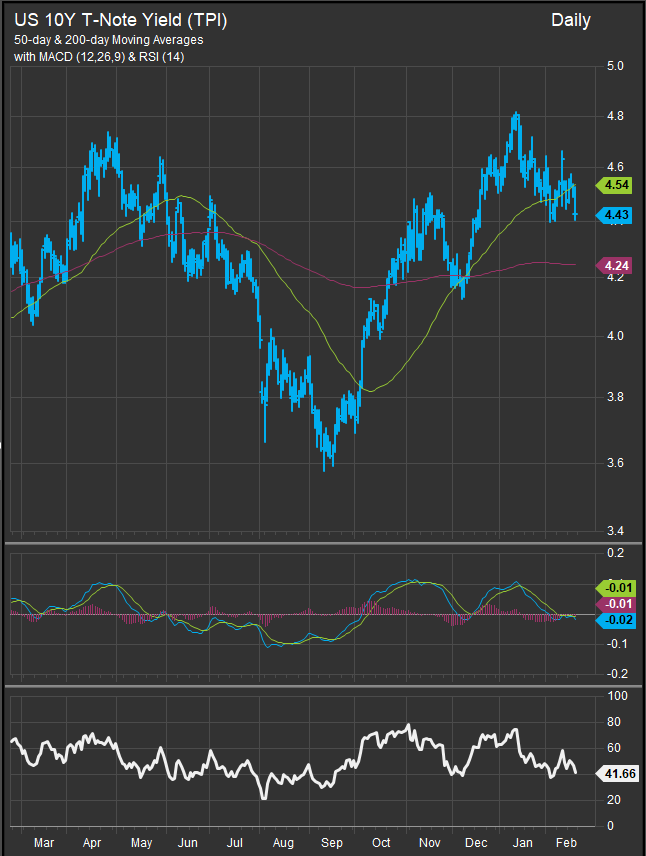
Rates Sideways, Homebuilders at Support
While commodities prices have moved higher, interest rates are moving towards the lower end of their respective intermediate-term price ranges. The US 10yr Yield (chart below) has backed off forays to the 4.8% level and is currently trading near 4.4% despite the recent move higher in commodities prices. This combination offers a whiff of the recessionary for us to consider, and the near-term behavior of defensive sectors shows many market participants are feeling some level of uneasiness.
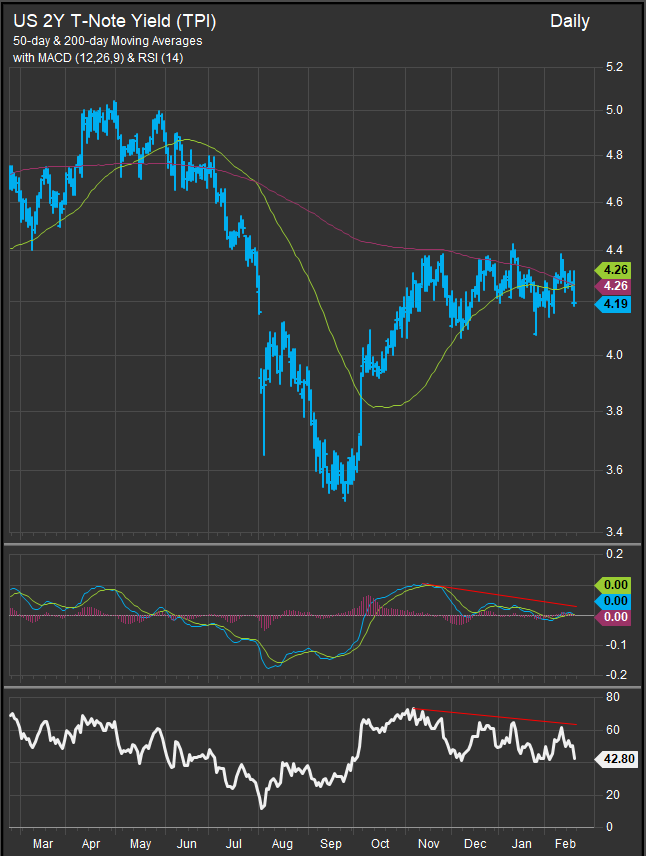
The 2yr Yield (chart below), which has been far less volatile than its longer duration counterpart, is below the 4.2% threshold, but doesn’t seem to be in a rush to go anywhere fast.
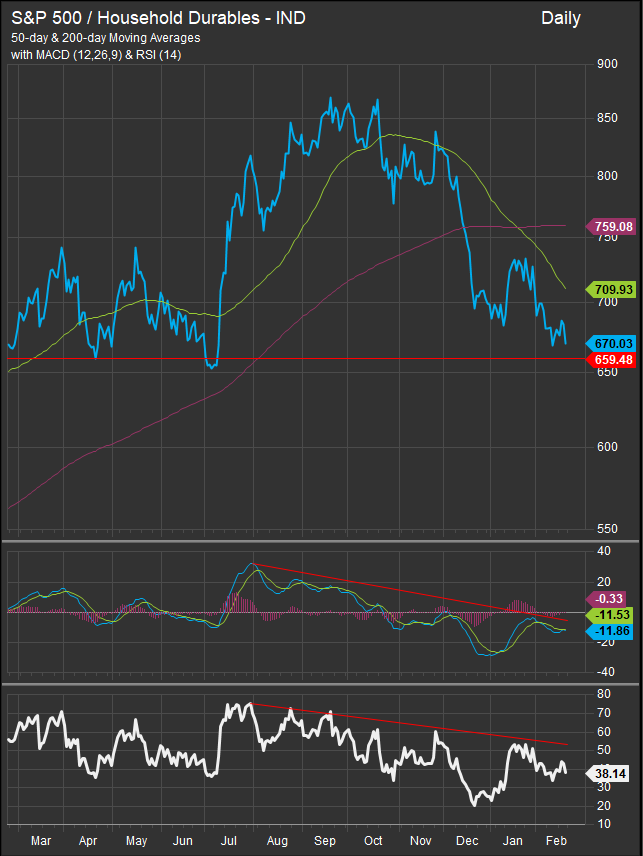
Despite benchmark rates moving sideways, homebuilders continue to retrace gains from earlier in the cycle with the S&P 500 Household Durables (chart below) now retesting intermediate-term support. Fed policy and a “soft landing” were seen as potential tailwinds to the cycle, but the economy hasn’t been soft enough to pull rates down and give consumers enough relief to buy homes. Mortgage rates are still high, manufacturing activity is slowing and wage gains have not kept pace with inflation over the course of the cycle.
The employment picture continues to be strong, but any cracks would likely solidify sentiment as risk-off. AI has been a motivating force behind the current bull market, but we still aren’t seeing where the supposed productivity boom will be spawning new categories of jobs and businesses that create new wealth. Right now what we’re seeing is that AI can replace certain job functions very efficiently and then people get laid off.
Excitement for this bull market is waning and the technical picture is showing evidence with momentum divergences cropping up in important themes that have supported the bull trend to date. Absent the emergence of a new catalyst, the charts and technical indicators we follow most closely are flashing caution here.
Patrick Torbert, Editor & Chief Strategist, ETFSector.com
Data sourced from FactSet Research Systems Inc.
