
May 30, 2025
Elev8 Model Input Scores: June 2025
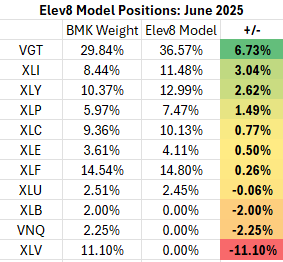
The table below shows the Elev8 model’s scores for June. Info Tech., Industrials and Discretionary sectors scored the highest in our model this month. We’ve rolled over our zero weight positions from May to June and we are out of the Healthcare, Materials and Real Estate sectors in June for the 2nd month in a row. Our Elev8 inputs are as follows:
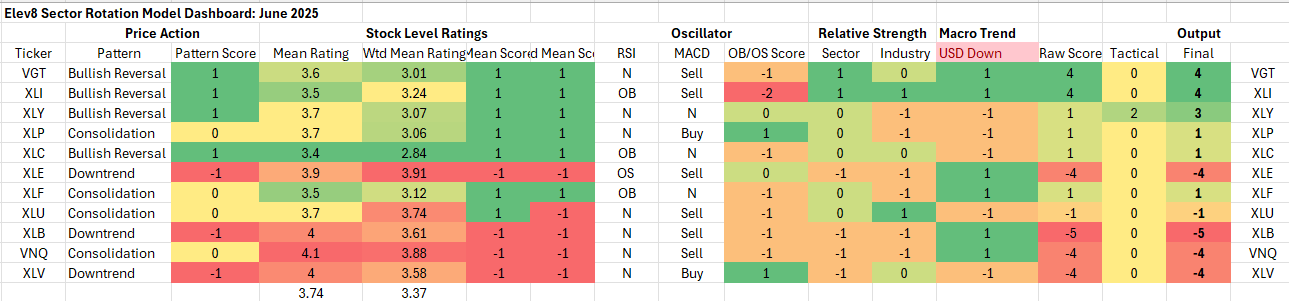
Key: Pattern = L/T (1yr+) Price Pattern of the Sector ETF, Mean Rating = simple average of 1-6 ratings (buy/sell) of all stocks within the sector, WTD Mean Rating = Cap Weighted Sector Constituent rating, OB = Overbought, OS = Oversold, N=Neutral
Model Input Commentary
The S&P 500 continued its bullish reversal in May. The risk-on trade has been obvious since early April lows for the index. The Energy sector is a marginal long in our work based on intermediate-term oversold conditions that we think will resolve sooner than later with the US travel season getting underway. We also have kept a tactical overlay on for the Discretionary Sector as the short-term trend for equities is clearly higher despite the 6-month trend, which is our model input, being sideways
At the macro level, we’re expecting a bounce from equities to continue. Interest rates have settled into their sideways range between 4.2 and 4.7% and commodities prices remain tame, both at the pump and at the broader index level. With macro trends at an equilibrium point, the message from the stocks drives our allocations. We continue see a market preference for larger stocks over smaller and Growth over Value when equity prices are moving higher at the index level. Industrial stocks are showing broadening upside participation in the near-term and Technology stocks have been the primary outperformers since equities began their bullish reversal. Historically, Discretionary stocks have also had a strong track record in reflating and uptrending equity market regimes.
Healthcare, Materials, Real Estate and Energy sectors scored the lowest in our model. These sectors have very narrow upside participation at the stock level and very few long-term winning stocks. The Energy sector is the most oversold of the bunch, and we have kept our modest long there as the sector historically outperforms only after periods of deep declines.
NOTE: We do have a logistical constraint to our portfolio. We instituted a base $10,000 cash portfolio alongside our model to track and model trading costs. Because of this, we don’t always have the ability to precisely match the model scores to the fund’s weighting position.
Elev8 Sector Rotation Model Portfolio: June Positioning vs. Benchmark Simulated S&P 500
Previous Positioning as of last Rebalance: April 29, 2025
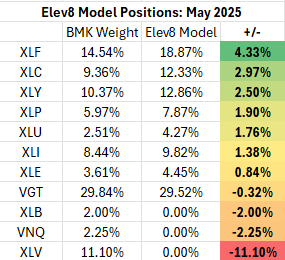
Financials lagged on the bounce in April despite showing strength entering the month and historically benefitting from rising equity prices at the index level. Given the loss of momentum, we have re-allocated our XLF overweight across positions in VGT and XLI. XLC is another area where we trimmed our long. Our main concern there is continued weakness in Alphabet Corp. (GOOG/L). The stock is at price support in a long-term uptrend, so we give it the benefit of the doubt in our process, but it is also close to triggering a sell signal and is on our downgrade watchlist.
Conclusion
May confirmed the bullish reversal for US equities and we’re expecting upside follow-through into June on improving sentiment on global trade, stable interest rates and contained commodities prices. Earnings season has been positive for US companies in aggregate and economic prints continue to be good enough. Rising interest rates remain our primary concern for the US business cycle over the longer-term, but for the time being the path of least resistance for the equity prices is higher. Check back soon as we’ll be posting our S&P 500 and Sector Outlooks for June this weekend.
About Elev8
We introduced the Elev8 Sector Rotation Model in June of 2024. Here’s a look under the hood at the inputs we use to score the 11 GICS Sectors for April and our resulting positions. The model includes up to 14 indicators that range from:
- Stock Level Technical Characteristics
- Macro-overlays:
- equity trend (S&P 500)
- interest rate trend (10yr US Treasury Yield)
- commodities trend (Bloomberg Commodities Index)
- USD trend (vs. EUR & Broad Currency Indices)
- Relative performance vs. the benchmark S&P 500
- Overbought/Oversold oscillator studies
We use the largest passive sector-based ETF by AUM ($) for each sector as our proxy for Elev8 sector positions. We select 8 out of 11 Sectors each month and have no exposure to the 3 with the lowest scores in our model.
Data from Factset Research Systems Inc.
