July 25, 2025
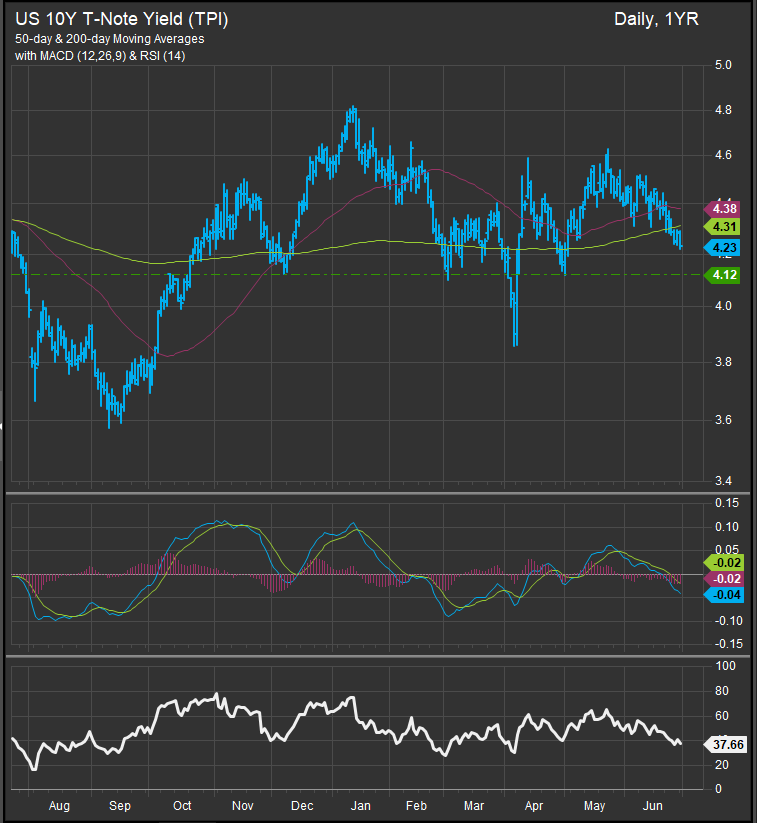
The more things change, the more they stay the same. Global trade realignment continues to shape the narrative around the business cycle, but despite more reasons to worry about inflation, CPI and interest rates have continued to show softness. The US 10yr yield is ticking down to long-term support (chart below) despite equity prices at new all-time highs and risk appetite having firmed since April. Much ado about nothing on inflation has been a persistent hallmark of the bull trend that started in 2023. We’re back to a similar dynamic.
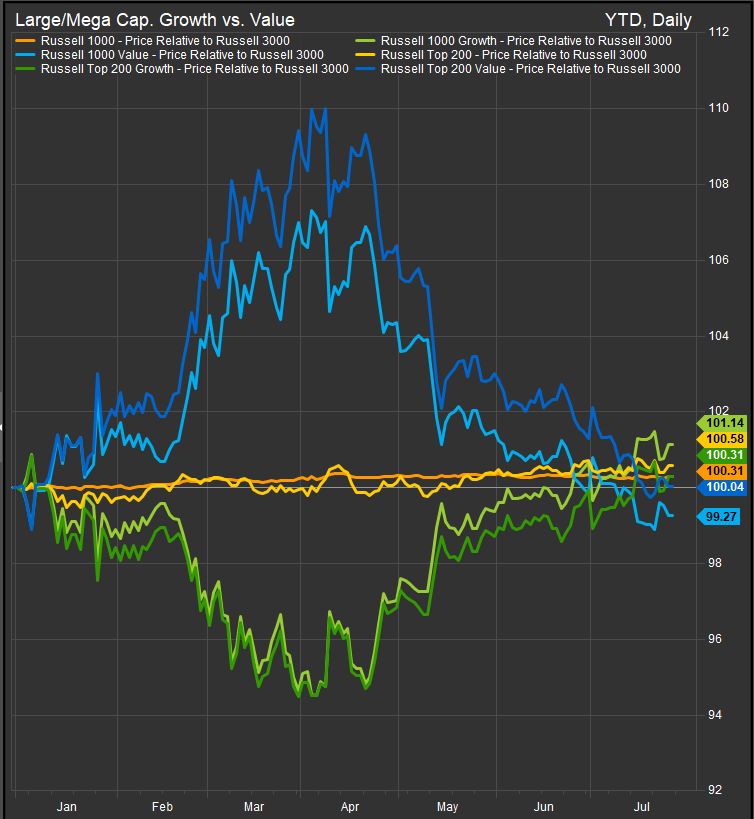
From a factor perspective, Growth vs. Value is also back in a familiar position, bisecting large cap. stocks with negatively correlated performance. Growth stocks have rallied to YTD gains vs. the broad market Russell 3000 index (chart below). Mag7, Semiconductors and networking equipment stocks are leading the way. Mega Cap. Growth is giving way to a broader mix of Large Cap. Growth leadership as seen by the Russell 1000 outperforming the Russell 200 off the April low.
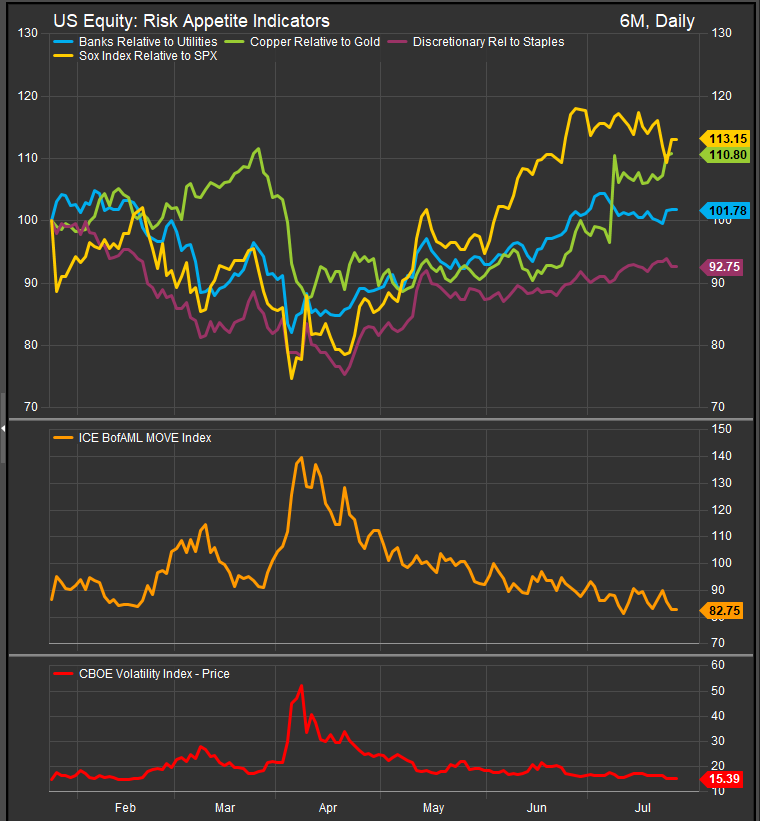
Risk Appetite remains firm as our “risk-on” ratios are showing strength (chart below). Dr. Copper, prized for its economic sensitivity is outperforming gold in the near-term while cyclical areas of the market have made steady gains vs. lower vol. counterparts since the low. Some near-term weakness in Semiconductor stocks will have to persist through NVDA earnings for us to take the chances of a correction seriously. Volatility gages, VIX and MOVE, are near lows for the year.
Our one concern as we approach a seasonal soft patch on the calendar from August – October is the wide performance spread between high beta and low vol. stocks off the April 7th equity market low. The chart below illustrates the dynamic and we think this could setup some profit taking when Wall Street goes on vacation next month. High beta has outperformed Min Vol. by around 30% off the April 7th low. Min vol. stocks typically outperform when they start from oversold positions, so the table is set for a defensive rotation this summer in that regard.

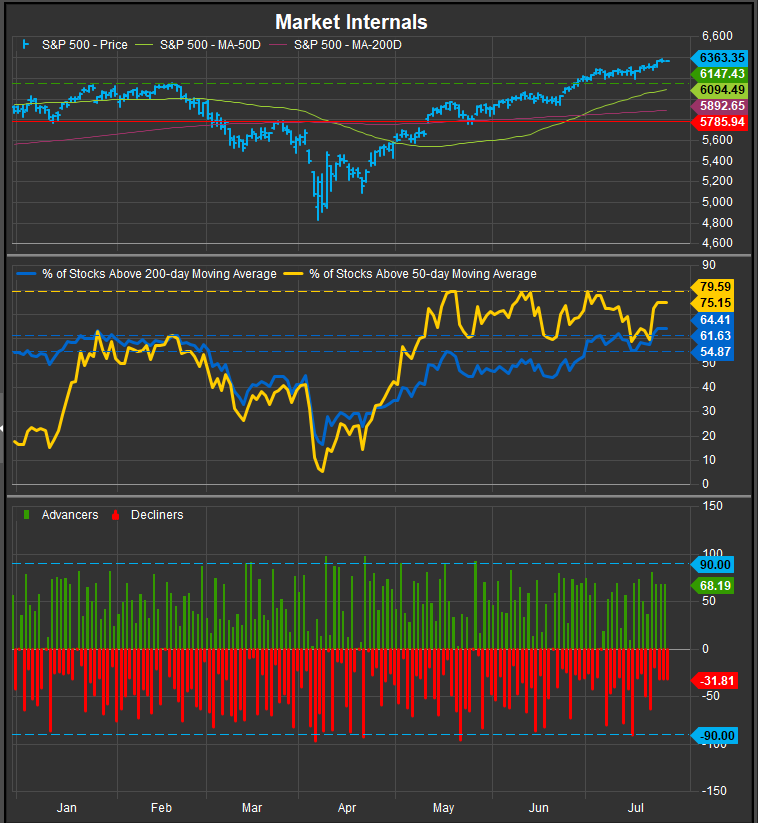
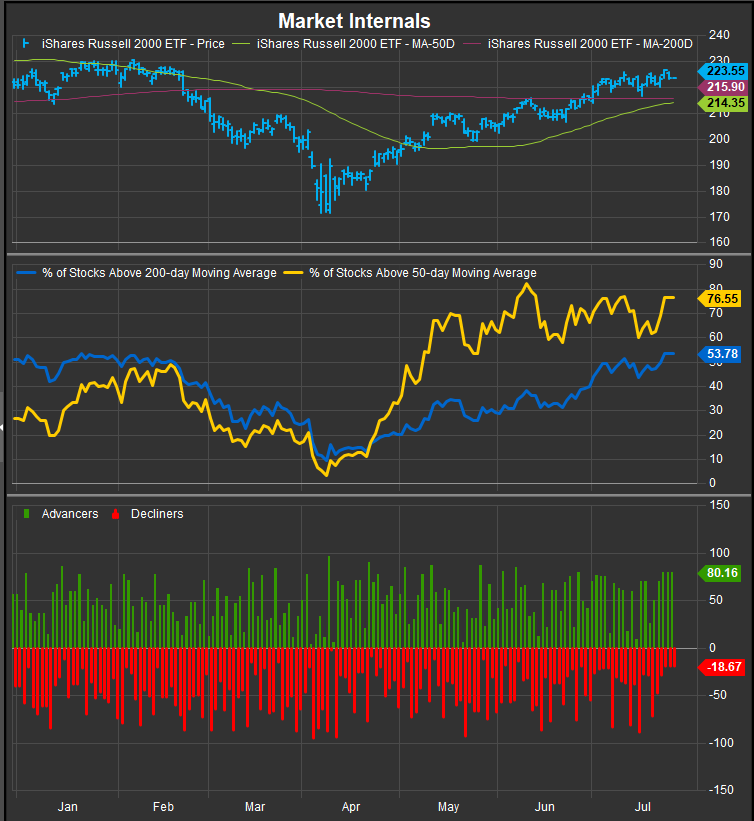
We recommend a defensive hedge given these developments, but we also want to point out that market breadth for the S&P 500 and the Russell 2000 is improving. Both indices are seeing the percent of constituent stocks above their 200-day moving averages expand to YTD highs (charts below). These are constructive developments, especially considering a that narrow participation has been a persistent criticism of this bull market.
SP50 Internals
IWM Internals
Conclusion
The performance spread between high beta and low vol. stocks has become extended with equities near overbought conditions. We think this sets up equities for profit taking as the calendar enters its weakest seasonal period from August through October. We think hedging with lower vol. is appropriate as a tactical consideration in the near-term, but given evidence of improving participation at the stock level, we think any corrections are likely to be accumulated over the longer-term.
Data sourced from FactSet Research Systems Inc.
