
October 2, 2025
We introduced our Elev8 model in June of 2024 and have been running it in its current form since August 28, 2024. Each month we review the previous month’s positioning and performance to identify what worked and what needs improvement. A brief description of the Elev8 model and its inputs follows the review as an appendix.
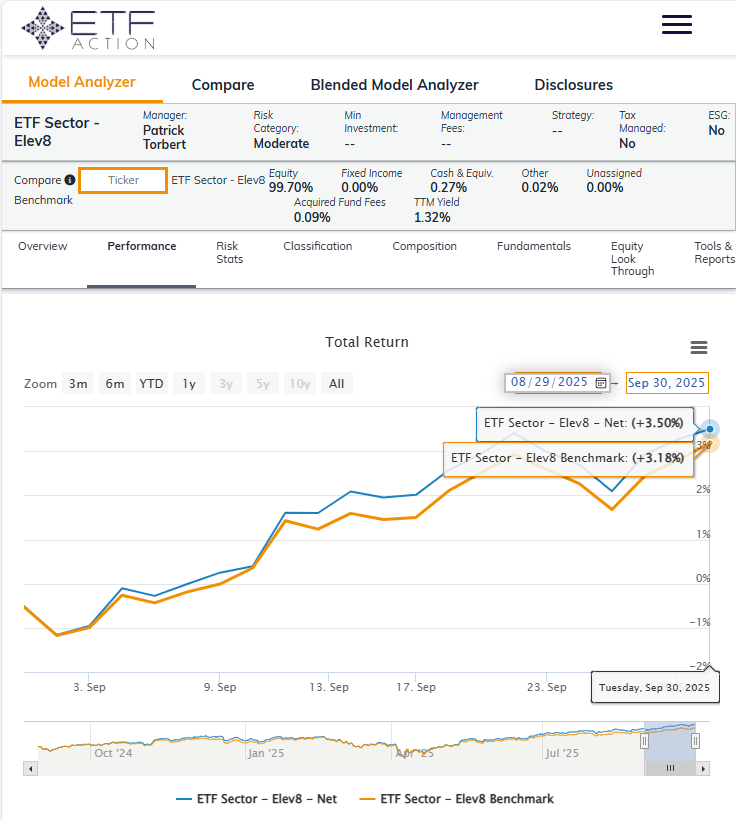
This September we start our second year actively managing the Elev8 portfolio. We are pleased to share that the portfolio outperformed in September 2025 posting an excess return of +32bps vs. our simulated S&P 500 benchmark.
Elev8 Model Indicator Dashboard & Positions (September 2025)
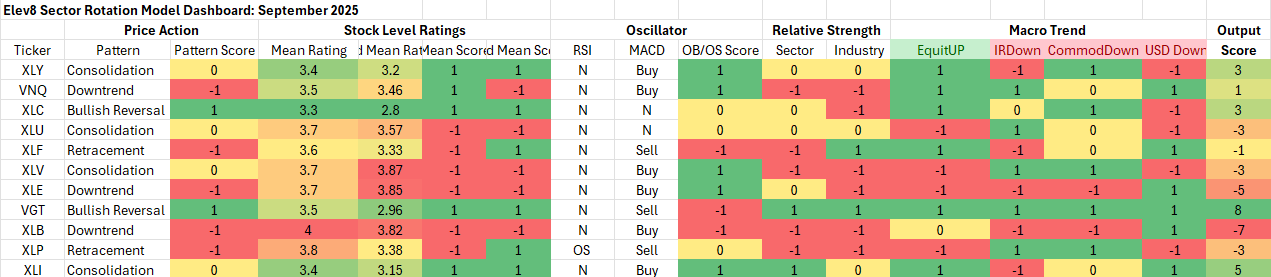
Key: Pattern = L/T (1yr+) Price Pattern of the Sector ETF, Mean Rating = simple average of 1-6 ratings (buyàsell) of all stocks within the sector, WTD Mean Rating = Cap Weighted Sector Constituent rating, OB = Overbought, OS = Oversold, N=Neutral
Performance Recap: Elev8 Performance vs. Benchmark (September 2025)
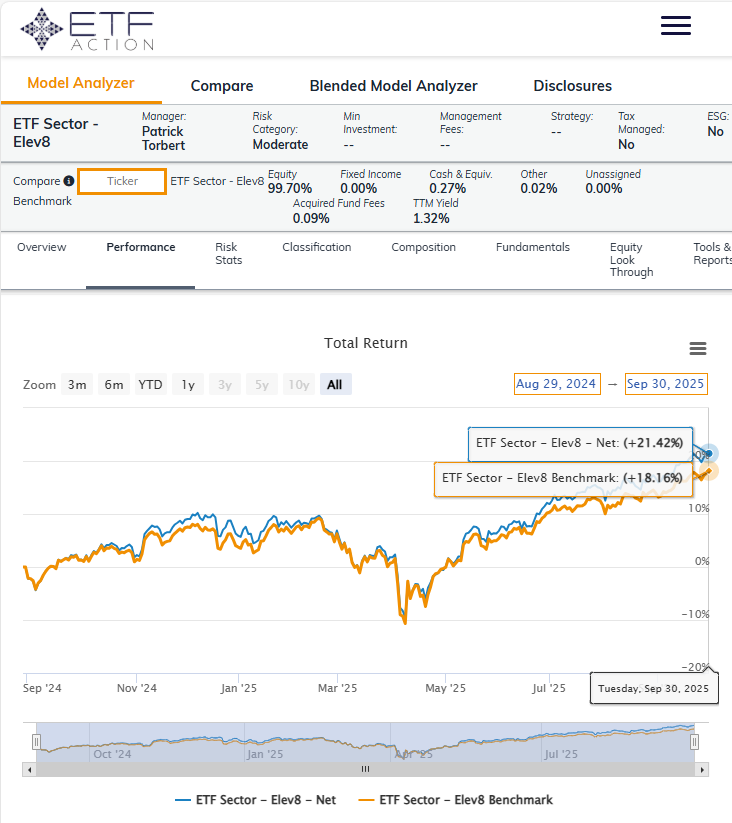
Performance Recap: Elev8 Performance vs. Benchmark (Sept. 1, 2024 – September 30, 2025)
What Worked in September
Our general positioning was in line with the market level trend as equities gained ground in September and the Elev8 model had us generally aligned with bullish exposures at a high level. What added value in the month was the short side of our portfolio. Staples (XLP: -629bps vs. SP500) Materials (XLB: -620bps) and Industrials (XLI: -200bps). In general risk on and Growth exposures outperformed in September and being short any of the low vol. or commodities space was a key to success. We were fortunate to have been out of the biggest decliners (Materials and Staples).
On the long side the model was correctly overweight the Comm. Services Sector and a big rebound from Alphabet Corp. pushed those shares to a positive excess return above the S&P 500 (+264 bps).
From a strategic perspective we had kept our portfolio tilts on the smaller side, so our missteps were manageable. More on those below.
What didn’t work in September
We came into September expecting some continued softness in the Information Technology Sector after it underperformed in August. That proved not to be the case as the sector led in September outperforming by +373 bps, but we were saved from taking a bath by going tactically short (178 bps UW) rather than out of the sector. Our other misses were in our Financial (+217bps) and Real Estate (+299bps) longs. We thought both sector would benefit from a dovish Fed moving to lower rates into year-end. That may still transpire, but each underperformed in September off 363bps and 372 bps respectively.
Overall, getting our shorts correct and making smaller proportional misses on some of our long positions netted out to a modest gain vs. the benchmark.
October Inputs & Positioning
Our model starts October long the Tech and Comm. Services Sector and out of Materials, Staples and Healthcare sectors. A dovish Fed, continued strong demand for AI themes and structural challenges to legacy businesses which dominate Staples, Materials and Healthcare sectors are high level reasons informing our choices along with the technical and macro inputs in our Elve8 model.
Elev8 Model Input Dashboard: October
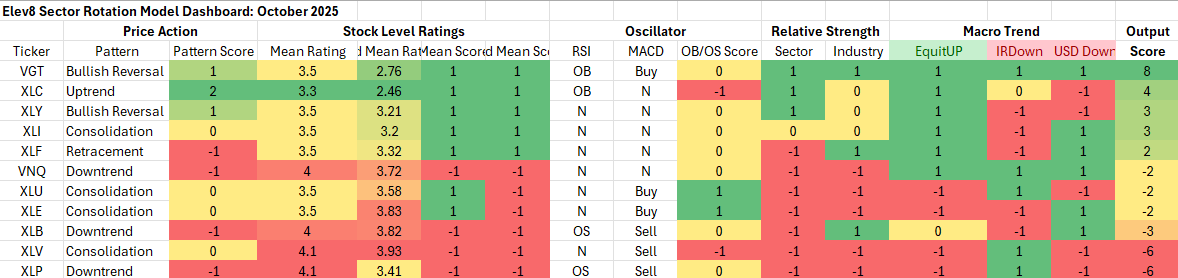
Key: Pattern = L/T (1yr+) Price Pattern of the Sector ETF, Mean Rating = simple average of 1-6 ratings (buyàsell) of all stocks within the sector, WTD Mean Rating = Cap Weighted Sector Constituent rating, OB = Overbought, OS = Oversold, N=Neutral
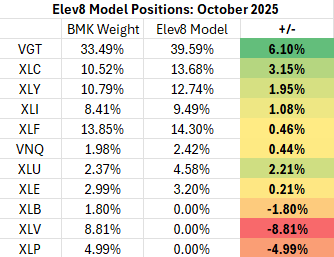
Elev8 Model Positions: October
Attribution provided by ETFAction, https://www.etfaction.com/
Other data provided by FactSet Research Systems Inc.
Appendix: What is the Elev8 Model
Elev8 Model
Elev8 is a sector rotation model that seeks to outperform the S&P 500 on a yearly basis by actively managing sector exposures relative to our simulated S&P 500 benchmark. The model seeks to generate alpha over its benchmark by allocating 100% of the portfolio to 8 of the 11 GICS Sectors comprising the S&P 500. It picks the 8 sectors that have the strongest scores in the model’s up to 14 inputs while having no exposure to 3 of the GICS Sectors that have the weakest scores in the model each month. The model can be above or below benchmark weight in the sectors it does have positions in.
Elev8 Model Inputs
- Stock Level Technical Characteristics
- Macro-overlays:
- equity trend (S&P 500)
- interest rate trend (10yr US Treasury Yield)
- commodities trend (Bloomberg Commodities Index)
- USD trend (vs. EUR & Broad Currency Indices)
- Relative performance vs. the benchmark S&P 500 at the sector and industry level
- Overbought/Oversold oscillator studies
