
December 5, 2025
We introduced our Elev8 model in June of 2024 and have been running it in its current form since August 28, 2024. Each month we review the previous month’s positioning and performance to identify what worked and what needs improvement. A brief description of the Elev8 model and its inputs follows the review as an appendix.
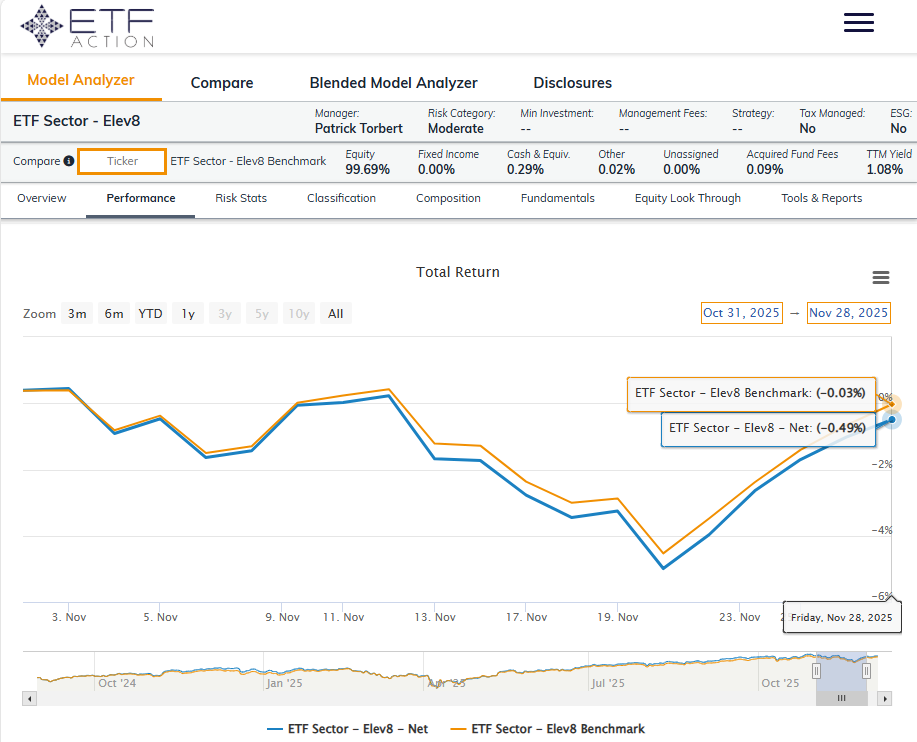
This month was a small setback for the Model’s performance as the portfolio underperformed in November 2025 posting an excess return of -46bps vs. our simulated S&P 500 benchmark.
Elev8 Model Indicator Dashboard & Positions (November 2025)
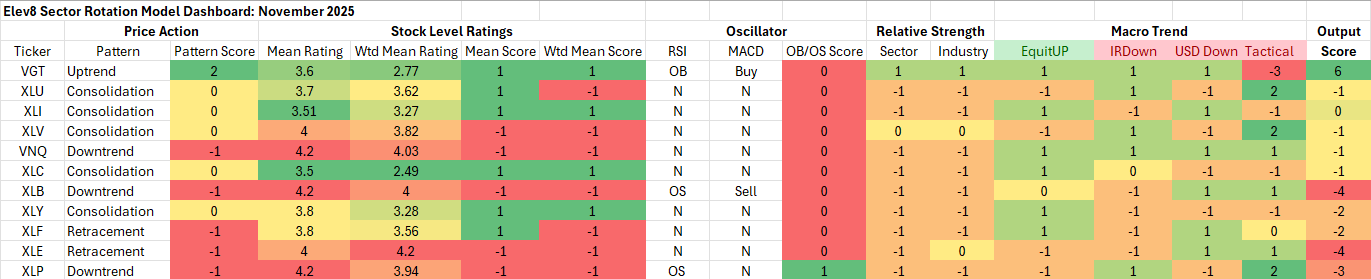
Key: Pattern = L/T (1yr+) Price Pattern of the Sector ETF, Mean Rating = simple average of 1-6 ratings (buy–>sell) of all stocks within the sector, WTD Mean Rating = Cap Weighted Sector Constituent rating, OB = Overbought, OS = Oversold, N=Neutral
Performance Recap: Elev8 Performance vs. Benchmark (November 2025)
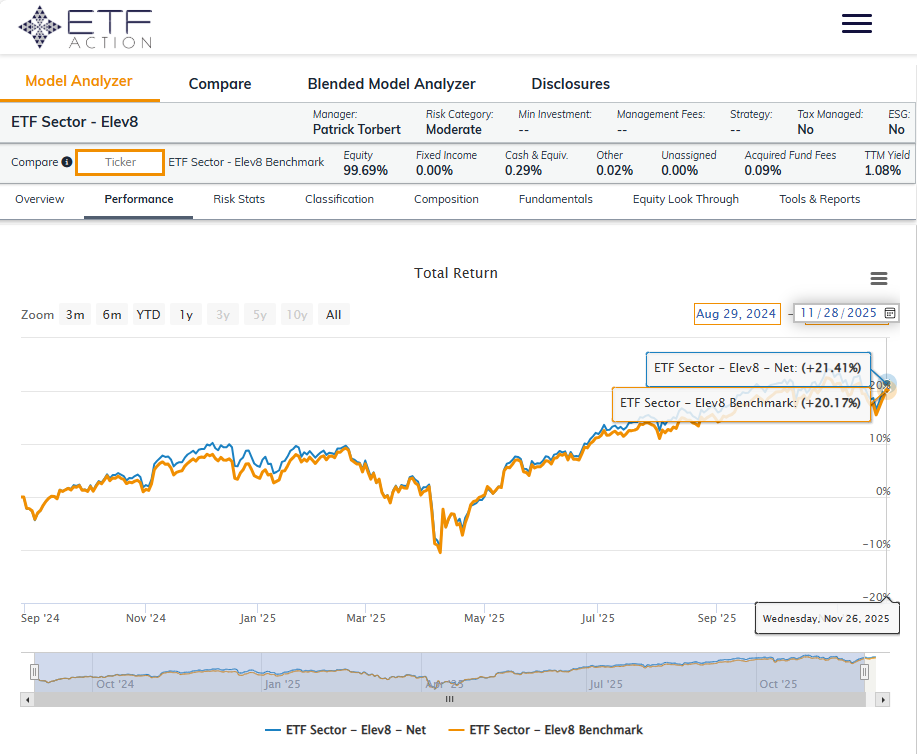
Performance Recap: Elev8 Performance vs. Benchmark (August 29, 2024 – November 28, 2025)
What Worked in November
It wasn’t a banner month for the Elev8 model in November. But our tactical screen was accurate in directing us towards defensive positioning. That led us to go long XLV +226bps (Healthcare Sector SPDR) with the sector leading in the month and outperforming by 882bps. Strong bullish reversals from Pharma, Biotech and Life Science/Tools industries triggered upgrades on strong near-term momentum at the stock level for the sector.
What didn’t work in November
Our biggest bet on the long side of the portfolio was a miss this month as the Elev8 model stayed overweight the VGT by 487bps relative to the S&P 500 Technology Sector weight. The Tech sector underperformed by approximately just 509bps (XLK vs. S&P 500) in November according to our calculations. Skepticism around AI valuations and Growth sustainability prompted profit taking. We also missed on the short side of the portfolio in November as XLP (Consumer Staples SPDR) XLE (Energy Sector SPDR) and XLB (Materials) outperformed the S&P 500 by +335bps, +298 bps and +334 bps respectively while we were out of each sector based on our model scores. Rotation away from Mega Cap. Growth exposures, bets on further easing from the Fed and firmness in underlying commodities prices were headwinds for those sectors. Our model inputs have a bias towards the strongest current trends and AI themes present a challenge for us when they run particularly hot and then correct within the context of a longer-term uptrend which is how we currently interpret the price action.
December Inputs & Positioning
Our model starts December rolling over our long in the Technology Sector (VGT) and bar-belling that high beta exposure with longs in Healtccare (XLV), Utilities (XLU), Energy (XLE), Materials (XLB), Comm. Services (XLC), Staples (XLP) and Real Estate (VNQ). We’re out of the Financial, Discretionary and Industrial sectors. We thin the set up for both Financials and Discretionary stocks is too reliant on dovish Fed policy and easing inflation narratives while we are concerned about cost pressures and deteriorating consumer credit. Financials have faced headwinds from stagnation in the housing market, declining loan issuance and margin pressures while declining manufacturing activity remains a headwind in place for industrials.
Elev8 Model Input Dashboard: December
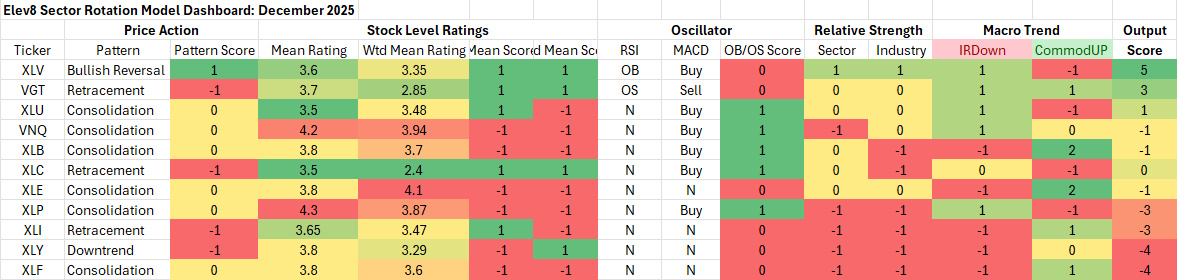
Key: Pattern = L/T (1yr+) Price Pattern of the Sector ETF, Mean Rating = simple average of 1-6 ratings (buyàsell) of all stocks within the sector, WTD Mean Rating = Cap Weighted Sector Constituent rating, OB = Overbought, OS = Oversold, N=Neutral
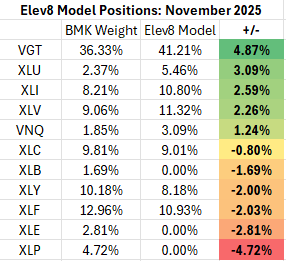
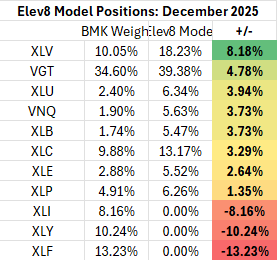
Elev8 Model Positions: December
Attribution provided by ETFAction, https://www.etfaction.com/
Other data provided by FactSet Research Systems Inc.
Appendix: What is the Elev8 Model
Elev8 Model
Elev8 is a sector rotation model that seeks to outperform the S&P 500 on a yearly basis by actively managing sector exposures relative to our simulated S&P 500 benchmark. The model seeks to generate alpha over its benchmark by allocating 100% of the portfolio to 8 of the 11 GICS Sectors comprising the S&P 500. It picks the 8 sectors that have the strongest scores in the model’s up to 14 inputs while having no exposure to 3 of the GICS Sectors that have the weakest scores in the model each month. The model can be above or below benchmark weight in the sectors it does have positions in.
Elev8 Model Inputs
- Stock Level Technical Characteristics
- Macro-overlays:
- equity trend (S&P 500)
- interest rate trend (10yr US Treasury Yield)
- commodities trend (Bloomberg Commodities Index)
- USD trend (vs. EUR & Broad Currency Indices)
- Relative performance vs. the benchmark S&P 500 at the sector and industry level
- Overbought/Oversold oscillator studies
- Tactical Overlays Include: Seasonality, Fiscal & Monetary Policy Interventions, VIX levels, Economic and Earnings alerts and considerations for exogenous events that are seen to be market moving.
