


Tactical Dashboard: April 22, 2026
Equity trend change on S&P 500, Nasdaq Composite, Russell 2000 upside break-out to new highs, Tech Sector bullish reversal signals, market breadth expansion, falling interest rates and geopolitical conflict resolution have aligned constructively. Risk appetite has shifted from negative to positive. Our short-cover signal has us rebalancing the models on our tactical dashboard inputs below to re-allocate both the Elev8 and Top3 models into month-end. Changes will be effected at today’s close. Breadth confirmation was the last piece that closed for the short-cover signal today. Not ideal, but if this is a longer-term melt-up we will be happier for it.
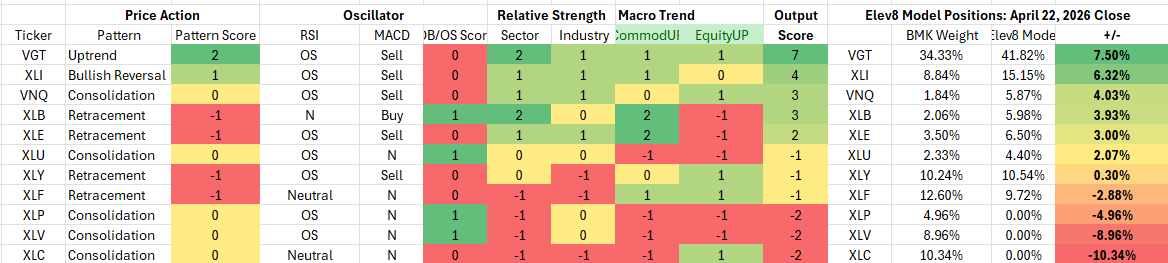
ELEV8:
TOP3:
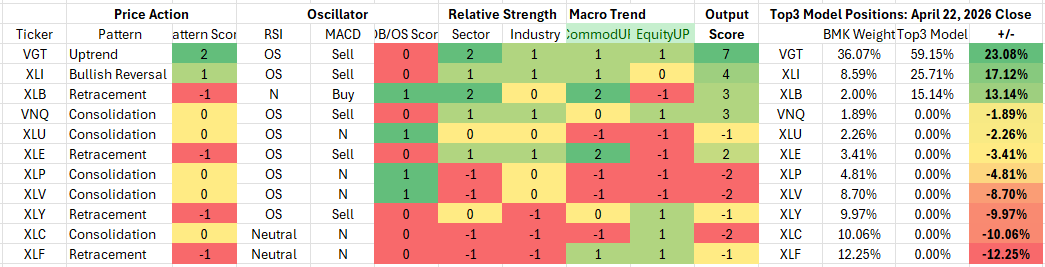
Key: Pattern = L/T (1yr+) Price Pattern of the Sector ETF, Mean Rating = simple average of 1-6 ratings (buyàsell) of all stocks within the sector, WTD Mean Rating = Cap Weighted Sector Constituent rating, OB = Overbought, OS = Oversold, N=Neutral
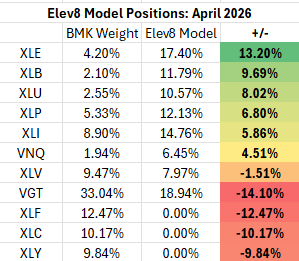
ELEV8 Sector Rotation Model Portfolio: April Positioning vs. Benchmark Simulated S&P 500 (data as of 3/30/2026)
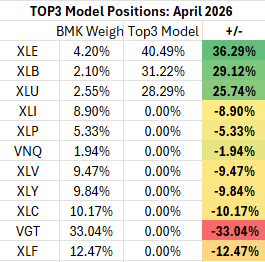
Top3 Sector Rotation Model Portfolio: April Positioning vs. Benchmark Simulated S&P 500 (data as of 3/30/2026)
Conclusion
The swings in sector behavior when Geopolitics intersect with crude price shocks and the powerful AI trend have been extreme in 2026. At the end of the day, the bull trend is a function of crowd enthusiasm. Buying power against the current backdrop is its own indication and with market level breadth expanding, there’s increasing technical evidence that the bull trend remains intact and potentially has upside.
About ELEV8
We introduced the ELEV8 Sector Rotation Model in May of 2024. Here’s a look under the hood at the inputs we use to score the 11 GICS Sectors and our resulting positions. The model includes up to 14 indicators that range from:
- Stock Level Technical Characteristics
- Macro-overlays:
- equity trend (S&P 500)
- interest rate trend (10yr US Treasury Yield)
- commodities trend (Bloomberg Commodities Index)
- USD trend (vs. EUR & Broad Currency Indices)
- Relative performance vs. the benchmark S&P 500
- Overbought/Oversold oscillator studies
About TOP3
We introduced the TOP3 Sector Rotation Model in May of 2024. Here’s a look under the hood at the inputs we use to score the 11 GICS Sectors and our resulting positions. The model includes up to 14 indicators that range from:
- Stock Level Technical Characteristics
- Macro-overlays:
- equity trend (S&P 500)
- interest rate trend (10yr US Treasury Yield)
- commodities trend (Bloomberg Commodities Index)
- USD trend (vs. EUR & Broad Currency Indices)
- Relative performance vs. the benchmark S&P 500
- Overbought/Oversold oscillator studies
We use the largest passive sector-based ETF by AUM ($) for each sector as our proxy for TOP3 sector positions. We select 3 out of 11 Sectors each month and have no exposure to the 8 sectors with the lowest scores in our model.
We use the largest passive sector-based ETF by AUM ($) for each sector as our proxy for ELEV8 sector positions. We select 3 out of 11 Sectors each month and have no exposure to the 8 sectors with the lowest scores in our model.
Data from Factset Research Systems Inc.
