
High Beta and Momentum remain in control, Value is beating Growth, and Energy and Technology lead the sector tape. Investors are concentrating exposure in AI productivity, energy security and current cash flow while consumers and rate-sensitive assets absorb higher costs.
The dominant market signal is continued nominal growth with elevated inflation and supply-chain risk. Recession remains a secondary concern.
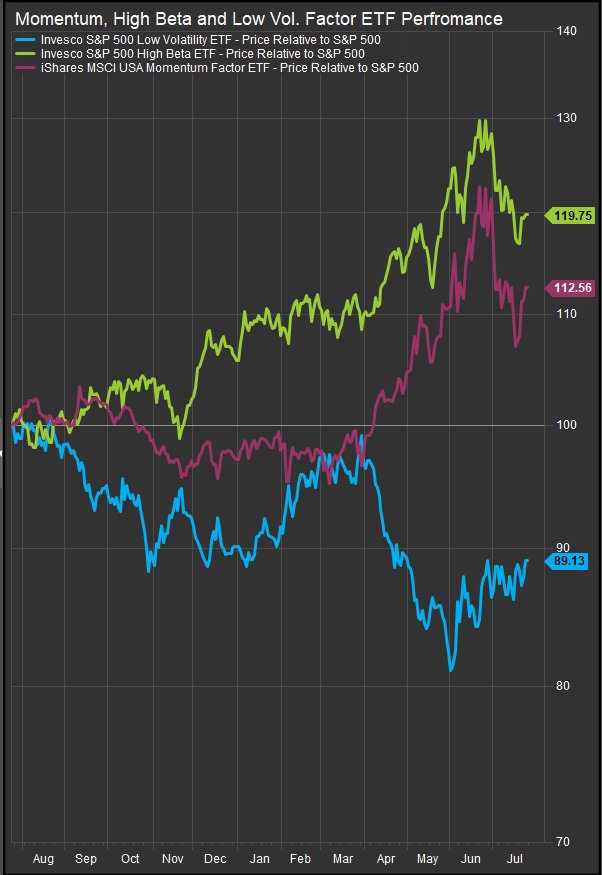
Over the past year, the Invesco S&P 500 High Beta ETF (SPHB) has outperformed the S&P 500 by 19.75%, while the iShares MSCI USA Momentum Factor ETF (MTUM) is ahead by 12.56%. The Invesco S&P 500 Low Volatility ETF (SPLV) trails by 10.87%.
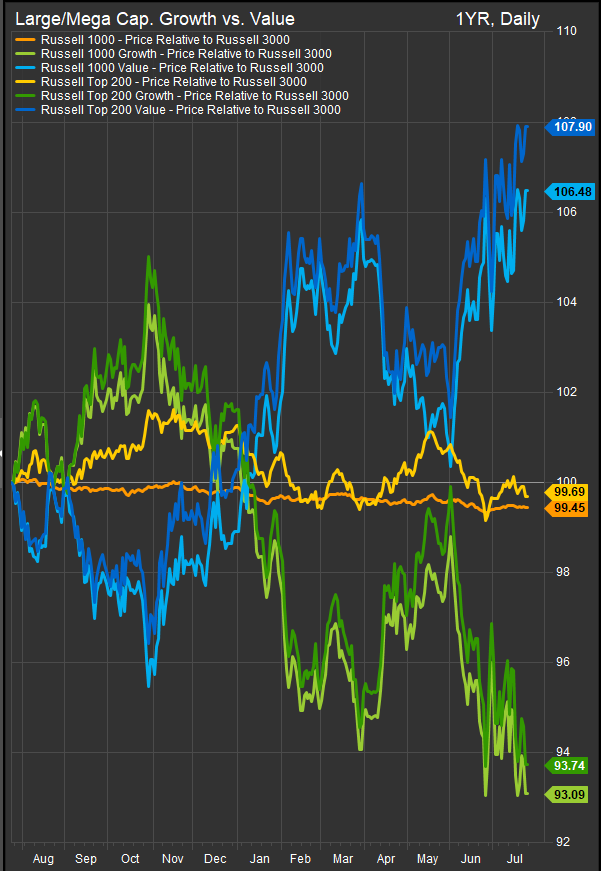
Value is also firmly ahead. Russell 1000 Value has outperformed the Russell 3000 by 6.48%, while Russell Top 200 Value is ahead by 7.90%. The corresponding Growth indexes trail by 6.91% and 6.26%, respectively.
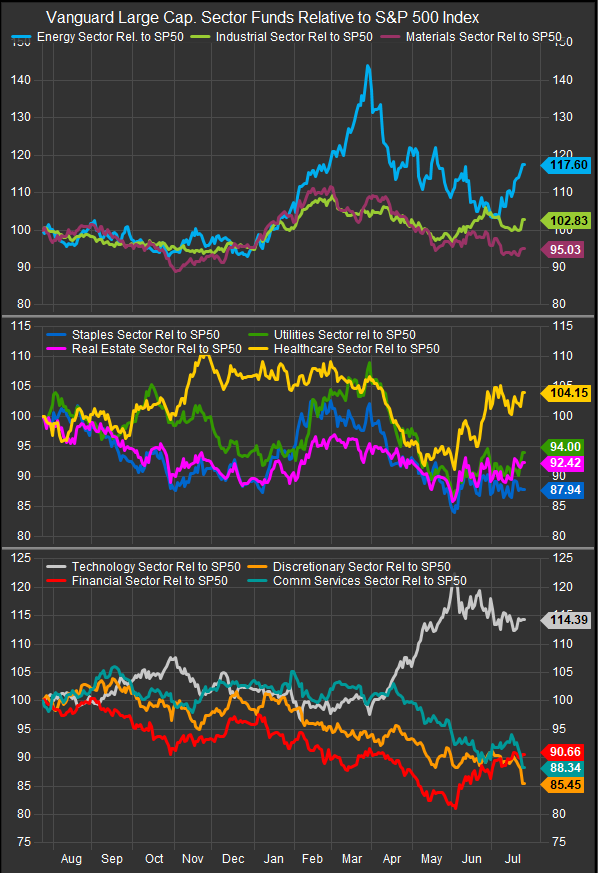
Those are aggressive factor signals, but sector leadership reveals a highly selective market.
One-Year Relative Performance
| Market signal | Relative price performance |
| High Beta vs. S&P 500 | +19.75% |
| Momentum vs. S&P 500 | +12.56% |
| Low Volatility vs. S&P 500 | -10.87% |
| Russell Top 200 Value vs. Russell 3000 | +7.90% |
| Russell 1000 Value vs. Russell 3000 | +6.48% |
| Russell Top 200 Growth vs. Russell 3000 | -6.26% |
| Russell 1000 Growth vs. Russell 3000 | -6.91% |
| Energy (VDE) vs. S&P 500 | +17.60% |
| Technology (VGT) vs. S&P 500 | +14.39% |
| Consumer Discretionary (VCR) vs. S&P 500 | -14.55% |
Relative price performance through July 24, 2026, based on the supplied FactSet charts.
Economic Data Support Continued Expansion
The economic backdrop remains uneven but expansionary. First-quarter real GDP increased at a 2.1% annual rate, following 0.5% growth in the fourth quarter. June retail sales were up 6.7% from a year earlier, and initial unemployment claims fell to 187,000 in the latest week.
The Federal Reserve’s July Beige Book reported slight-to-moderate economic growth in 11 of 12 districts. The Philadelphia Fed manufacturing index rose to 41.4, its highest level since November 2021, with new orders and shipments also reaching multiyear highs. Payroll growth has slowed to 57,000 in June, but the unemployment rate remains 4.2% and layoffs remain subdued.
That combination explains the strength in High Beta and the deep underperformance of Low Volatility. Investors continue to expect corporate earnings growth, capital investment and stable employment. They are also differentiating sharply between companies positioned to capture that growth and those facing higher financing, fuel and input costs.
Energy and Technology Define the Leadership Barbell
Energy (VDE) leads every sector, outperforming the S&P 500 by 17.60% over the year. Technology (VGT) follows at 14.39%. Industrials (VIS) and Health Care (VHT) are modestly ahead, while every other sector trails.
Energy leadership reflects both commodity scarcity and transportation risk. Oil moved above $100 per barrel this week as conflict expanded around the Strait of Hormuz and Bab el-Mandeb. Asian LNG prices reached approximately $22 per million British thermal units, their highest level in four months. EIA data show oil flows through Hormuz averaged 14.6 million barrels per day in the first quarter, down roughly 28% from 20.4 million a year earlier.
Technology leadership is similarly concentrated. As of May, semiconductors represented 37.9% of VGT, while Nvidia, Apple and Microsoft collectively represented almost 42% of the fund. The sector proxy therefore captures the companies supplying processing power, memory, equipment and platforms for the AI buildout more directly than a diversified Growth index.
The AI trade is entering a more demanding phase. Reuters estimates that hyperscaler capital expenditures could rise by approximately $534 billion through 2027, compared with a $340 billion increase in operating cash flow. Alphabet raised its 2026 capital-spending forecast to $195–$205 billion, even as Google Cloud revenue increased 82%. Investors continue to reward AI demand while requiring clearer evidence that revenue and cash flow will justify the investment.
That tension is visible in the factor chart. High Beta and Momentum remain strong over the full year but have retreated from their June peaks. The market still favors innovation and operating leverage, with a lower tolerance for capital spending that lacks visible payback.
Value Leadership Reflects Cash-Flow Discipline
Value’s advantage over Growth is substantial, but the sector data show narrow cyclical participation. Financials (VFH) trail the S&P 500 by 9.34%, Materials (VAW) by 4.97% and Consumer Discretionary (VCR) by 14.55%.
Value leadership therefore reflects a preference for current earnings, energy exposure, dividends and less demanding valuations. It is being reinforced by weakness in several Growth-heavy areas, including Consumer Discretionary and Communication Services (VOX), rather than by uniform strength across banks, commodities and consumer cyclicals.
Technology’s outperformance can coexist with Growth’s underperformance because AI leadership remains concentrated in a relatively small group of semiconductor, hardware and infrastructure companies. Broader Growth indexes also carry exposure to consumer platforms, media companies and other long-duration businesses that have struggled with high financing costs and questions about capital efficiency.
Higher Rates Are Penalizing Conventional Defense
Treasury yields remain restrictive even after June inflation softened. As of July 22, the two-year Treasury yielded 4.31%, the 10-year 4.67% and the 30-year 5.15%. June core CPI was unchanged for the month and rose 2.6% year over year, but renewed oil and shipping pressure has preserved the risk of another inflation impulse.
The rate backdrop helps explain why conventional defensive assets have struggled. Utilities (VPU) trail by 6.00%, Real Estate (VNQ) by 7.58%, Consumer Staples (VDC) by 12.06% and Low Volatility by almost 11%.
Quality has offered limited protection. The S&P 500 Quality proxy is only 0.79% ahead of the Russell 3000, while small-cap Quality trails by 1.69%, mid-cap Quality by 5.60% and international Quality by 13.16%.
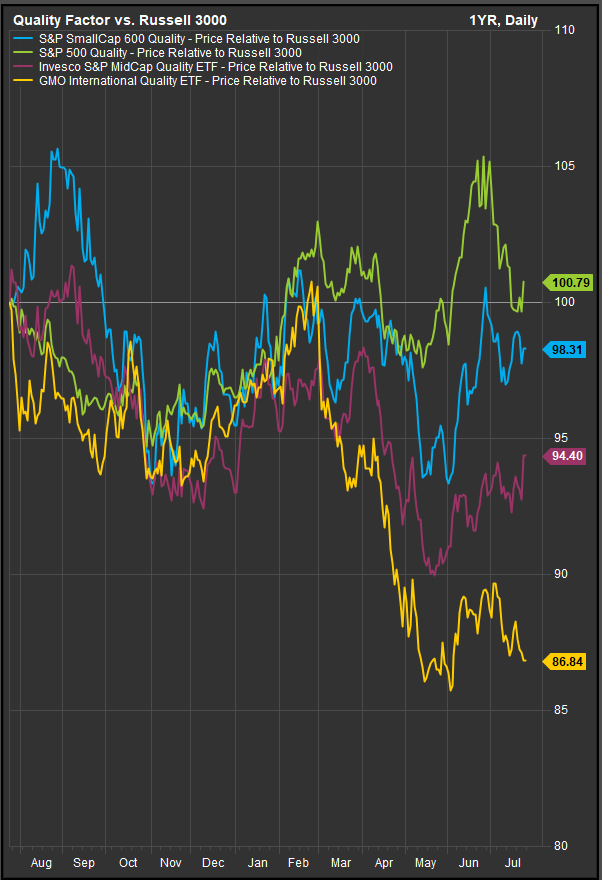
Investors are rewarding earnings visibility where it is scarce rather than paying a broad premium for low volatility or strong balance sheets. Large AI platforms and profitable infrastructure suppliers can qualify as high-quality businesses, but the market is purchasing them for growth and strategic positioning rather than for defensive characteristics.
Investment Implications
The factor and sector tape supports a selectively risk-on posture:
- Technology (VGT): Favor AI infrastructure, semiconductors, memory, equipment and platforms with visible monetization. Recent weakness requires greater attention to capital efficiency.
- Energy (VDE): Leadership remains supported by geopolitical scarcity, constrained shipping capacity and higher commodity prices.
- Industrials (VIS): Defense, automation, electrical equipment and data-center construction remain favored areas within an otherwise narrow cyclical expansion.
- Value: Retains an advantage over broad Growth through current cash flow, valuation support and energy exposure.
- Consumer and rate-sensitive sectors: VCR, VDC, VNQ and VPU remain pressured by high yields, fuel costs and household price sensitivity.
Recession positioning would normally bring sustained leadership from Low Volatility, broad Quality, Staples, Utilities and Real Estate. Intermediate-term trends support High Beta, Momentum, Energy and concentrated Technology exposure.
The market is pricing a supply-constrained expansion: growth remains positive, AI investment remains powerful, and geopolitical disruption is supporting energy and inflation risk. The principal vulnerability is concentration rather than imminent economic contraction.
Sources
FactSet Research Systems Inc. sector, style and factor proxy charts through July 24, 2026; Bureau of Economic Analysis GDP data; Bureau of Labor Statistics employment and inflation reports; Department of Labor unemployment claims; Census Bureau retail-sales data; Federal Reserve Beige Book and Philadelphia Fed survey; U.S. Treasury yield data; EIA energy-chokepoint analysis; Vanguard portfolio data; Reuters market, AI-capex and geopolitical reporting.
Disclaimer: This material is for informational and educational purposes only and does not constitute investment advice, an offer to sell or a solicitation to purchase any security. Factor and sector relationships can change rapidly. Past performance does not guarantee future results.
