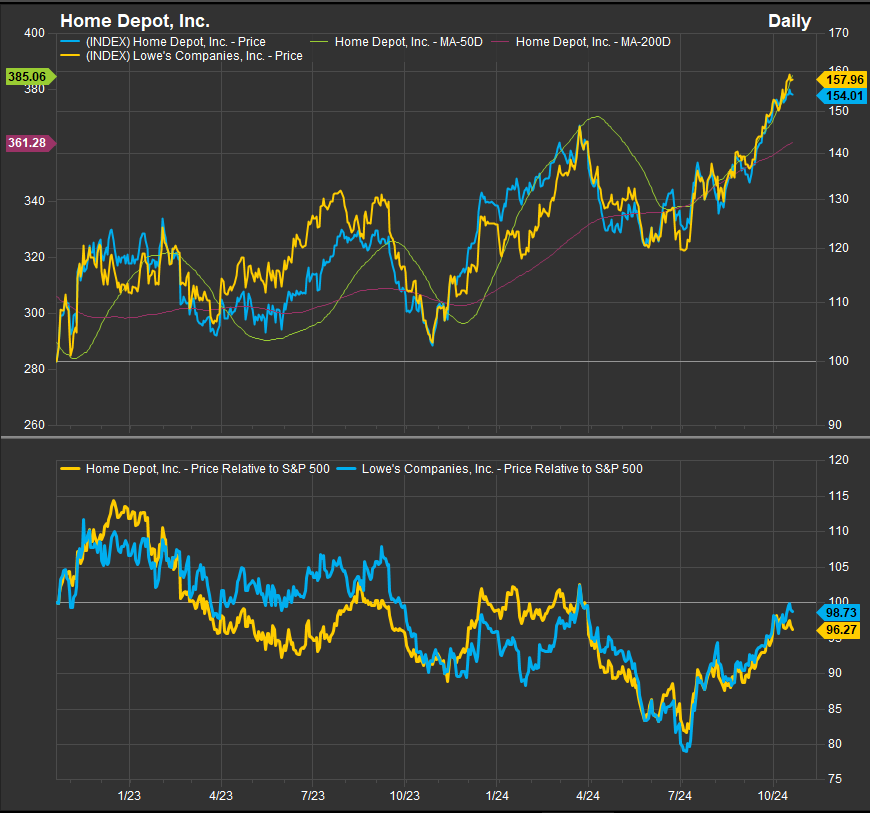
Last week we talked about the feedback loop between bullish narratives around “Soft Landing” and “No Landing” scenarios that have caused interest rates to back up recently. Those bullish narratives have firmed as consensus flowing from the Fed’s dovish policy and economic data that has managed to thread the needle between inflation and outright contraction. We had been wondering whether rising rates would spark some “risk-off” behavior, but we are seeing from the Dow Transports (chart below) that investors are continuing to position bullishly. The Transports broke out last week to YTD price highs. As we mentioned last week, no less an eminence than Charles Dow theorized that bullish price action from his eponymous transportation index, manifesting in new highs over the intermediate term, serve as confirmation of the primary trend and historically have led to above average forward returns. The Dow Jones Industrial Average has made multiple new highs over the past few months, and we were looking for a bullish sign from the Dow Transports to confirm. Now we have it.
We are not 10-K chewing CFA’s at ETFSector.com, but we like to see clear proxies of economic activity ramp higher concurrently with new all-time highs for US equity market indices. The economic data we have been following over the past 6 months shows increased pressure on consumer spending due to high interest rates and aggregate changes in inflation over the past 5 years. That narrative is changing for the positive on the margins. On the capital goods and production side of the coin, factory orders and inventory gages are showing some stagnation. This has been offset by continued expansion in retail and service segments. The question has always been whether dovish policy could solve for one or more of these recessionary pressures. Price action in the Transports shows that investors are warming to the bullish scenario.
Further confirmation will come from the sector leadership mix moving forward. We saw lower vol. sectors outperform over the summer, and now we are seeing cyclicality get a boost from the Fed’s rate decisions and likely from the campaign policy happy talk and boasting that typically precedes US presidential elections.
–Patrick Torbert, CMT | Chief Strategist, ETFsector.com
Sector ETF’s/The Week in Review

Using the Sector SPDR Funds as proxy we are getting a mixed message from sector leadership last week. Breadth was positive with 9 of 11 GICS sectors positive on an absolute basis. Outperformers included Utilities, Real Estate, Financials and Materials, while Energy and Healthcare were negative performers on the week. Historically, Financials, Materials, Utilities and Real Estate are an odd combination for sector leadership, and we don’t expect this mix to be durable. What we do think this signifies is a realization that rising rates could threaten the expansion and higher yields in the near-term could cause some potential stagnation down the road.
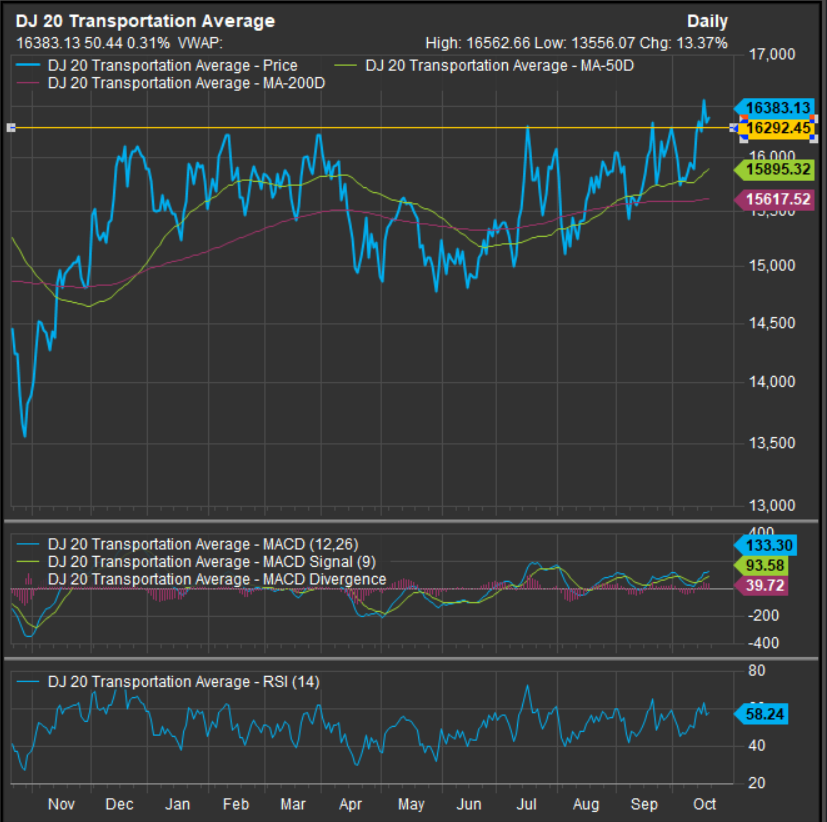
We talked about Dow Theory signals in our lead in as ways to use the equity market as a proxy for the economy that can help us invest and position. Economic proxies within the stock market are abundant. One market segment that clearly drives the current cycle is housing. There is a shortage of affordable homes across the country, but profit dynamics in the industry incentivize building large luxury homes over affordable homes for new families. With rates high and costs having risen dramatically over the past 5 years, many who wish to trade up into a bigger home are unable to do so, and many who would like to sell a big home are hard pressed to find a buyer at their price. Wealth inequality can exacerbate the dynamic as many home sellers who have other financial assets lack motivation to sell in this environment and have the means to sit on their inventory. As a result, the market isn’t suffering lack of demand, it is impaired based on a confluence of underlying conditions that don’t have easy solutions. The result in the near-term is homebuilding stocks outperforming over multiple time frames since the bull cycle re-emerged in 2023 even while other Consumer stocks fail to beat the market.
The chart below shows the longer-term price action of the 16 stocks in the S&P 1500 Composite Homebuilding Sub-Industry. This group of stocks has beaten the S&P 500 by almost 50% over the past 2 years.
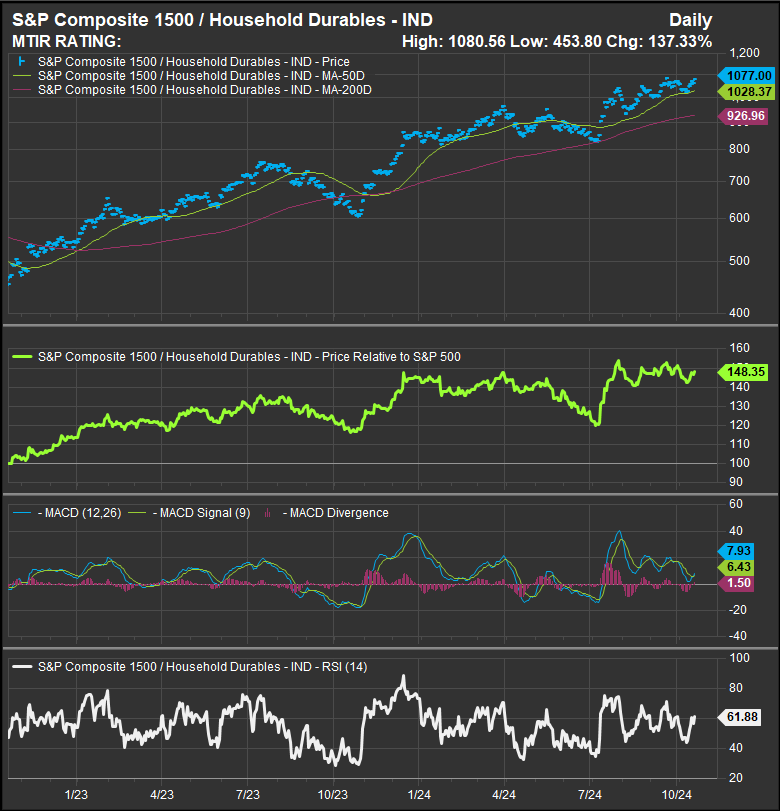
This has been in sharp contrast to other consumer proxies. For example, home improvement retail heavyweights HD and LOW. In past cycles, these stocks would accompany homebuilders higher as consumers would typically buy homes and then feather their nests at the same time. But we can see over the same time period where homebuilders outperformed by 50%, these stocks have spent much time on the ropes. Only recently have they finally trended towards equilibrium vs. equities broadly. If we see new highs in relatives for both these consumer bellwether stocks, we’d take that as a positive sign for re-establishing a Consumer led bull market cycle.
Discretionary vs. Staples remains one of our key risk-on/risk-off indicators. Discretionary stocks at the sector level are currently in an oversold position vs. Staples and need the buyer to step in to keep us sanguine regarding higher prices in the coming week.
The US 10yr Yield continues reversal higher
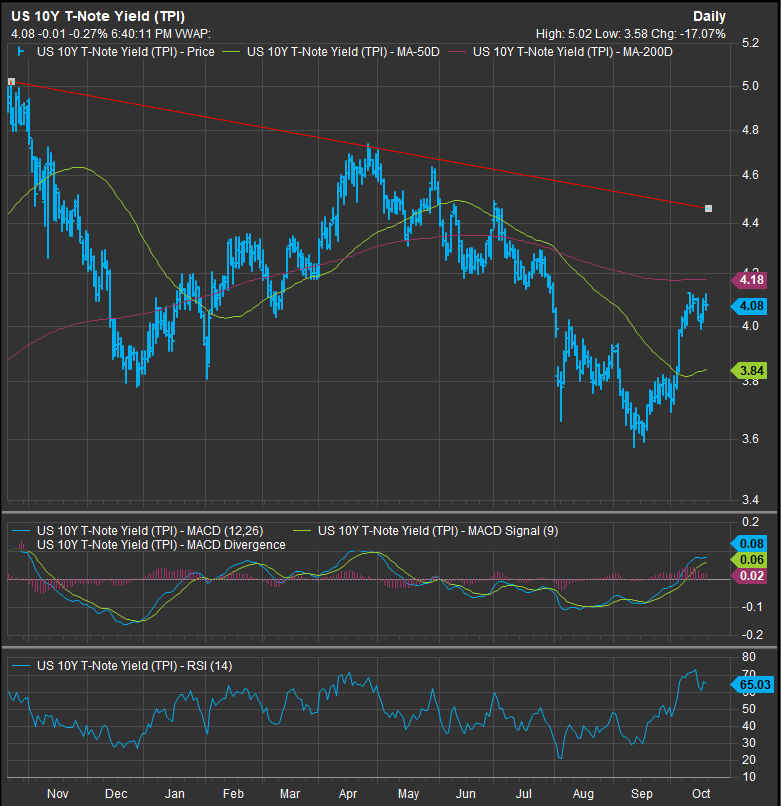
The chart of the US 10yr Yield shows a continued bullish reversal pattern with potential to retest YTD highs from April at the 4.74% level. This week is a pivot as near-term resistance has begun to form at 4.12. The 200-day moving average sits a drop higher at 4.18%. Our bull case expects the advance in yields to fail below the 4.4% level and move lower into year-end.
Commodities Prices Failed at Resistance
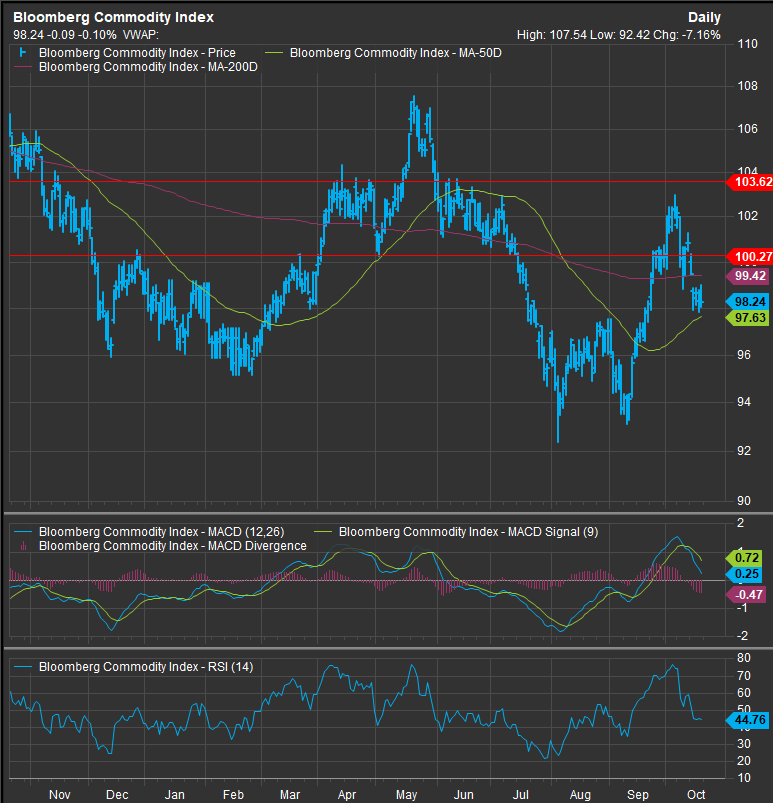
Commodities prices failed below resistance on October 4th and rolled over. They enter the new week at a potential accumulation point, but the rally, now in hindsight lacked significance as a bullish reversal signal. We are not as scared of rising interest rates when they are unaccompanied by rising commodities prices. While the situation, especially ahead of a presidential election, is obviously fluid, we interpret rising rates on their own as a potentially bullish sign. And we can point to some technical evidence that the August 5th pivot was significant.
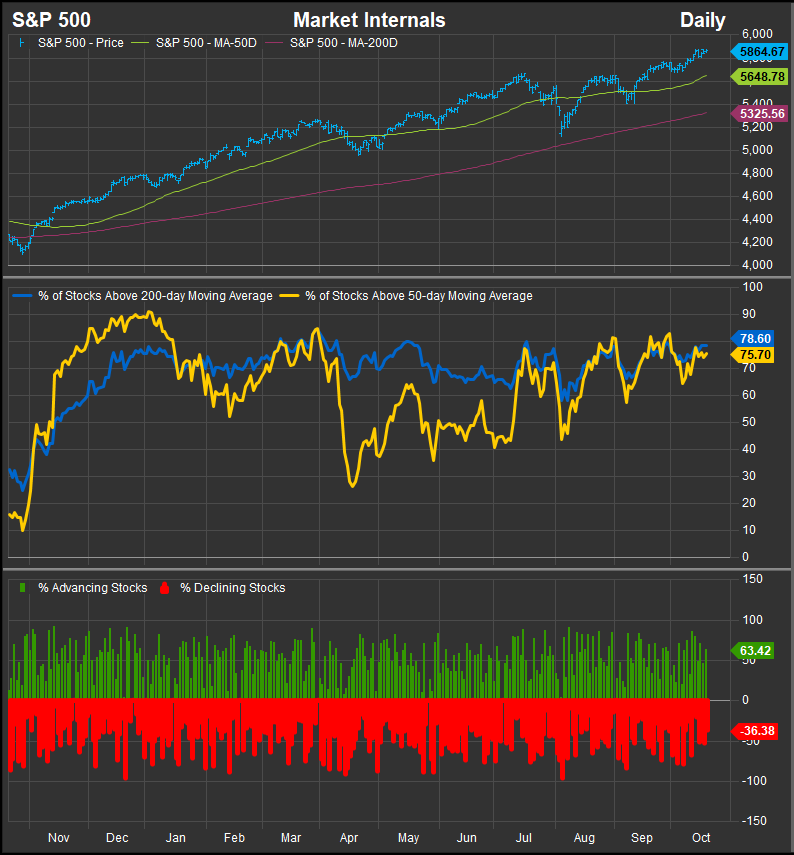
S&P 500 Internals showed a significant bullish reversal off the August 5th low.
Reviewing the S&P 500 market internals chart we see evidence of a coiling spring since August 5th low. That low was marked by a 90%+ down day as measured by %advancers/%decliners on August 4th, followed by a 90+% up day on August 8th. The daily percentages are in the bottom panel of the chart. This kind of capitulation buying and selling often marks significant pivots. Further, we can see that since the S&P 500’s low in April we have made sequential higher lows on the # of stocks above their 50-day moving average. In a bull market this shows persistent buying power.
Semiconductors at a key pivot point
The bull market is testing out new leadership profiles as investors continue to position around a dovish Fed and the potential for the economy to reaccelerate. The 2023-2024 bull market advance has been led by Semiconductor stocks in general and NVDA in particular, but while we noted that market internals are firming and the Dow Transports have thrown off a bullish signal, Semiconductors as measured by the SOX Index (chart below), are looking a little tired. Still well below July highs, the Index remains in a modestly bullish price structure above the 5000 level. The Index sits in a holding pattern and will be a key component to determining leadership.

Conclusion
Rates are rising on bullish positioning in the near-term. Without a coincident rise in commodities prices, we think this is benign for the bull trend, but could impact leadership and would likely promote value exposures like XLF and XLI over XLK and XLY for example. The SOX Index is looking a little tired regarding its attempt to form a bullish reversal off the August low. If Semiconductors fail as transports break-out, we could see a key shift away from previous Growth and AI themed leadership into a broader cyclical advance.
Data sourced from FactSet Research Systems Inc.

