April 10, 2025
Price action in the S&P 500 over the past several weeks has been characterized by volatility and large daily price moves in both directions. Yesterday’s >9.5% gain for S&P 500 came on record volume and was the largest daily up move since 2008. While such a bullish capitulation isn’t a bad thing (it could be part of a bottoming pattern and sets a support zone for prices), a very big one day upside move within the context of a downward trend for equities prices is not in and of itself a sign that the downtrend is over.
As we mentioned in our lead yesterday’s up move was the largest since 2008. Most of us don’t need reminding that 2008 was the year of the Global Financial Crisis which precipitated a >50% peak-to-trough decline in the S&P 500 from September of that year through March of 2009. We bring this up to point out that extremely large one day price moves have often occurred in the middle of large intermediate-term drawdowns for the S&P 500. Many of the biggest one day up moves in the history of US equity markets transpired from 1929-1932. Below are lists of the biggest one-day gains for the modern S&P 500 which began ticking in 1957 as a 500 company, broad market stock index as well as from the data series that includes deep history going back to the original 90-stock S&P 500 which started ticking in 1926.
Post 1957 (Modern) S&P 500 Largest Daily Gains (%)
| Rank | Date | Gain (%) | Context |
| 1 | Oct 13, 2008 | +11.58% | Global financial crisis – coordinated global bank rescue efforts. |
| 2 | Oct 28, 2008 | +10.79% | Continued market volatility during the financial crisis. |
| 3 | Mar 24, 2020 | +9.38% | Stimulus optimism during early COVID-19 pandemic. |
| 4 | Oct 21, 1987 | +9.10% | Post–Black Monday rebound. |
| 5 | Mar 13, 2020 | +9.29% | Volatile bounce during early COVID crash. |
| 6 | Nov 13, 2008 | +6.92% | Another relief rally during the 2008 crisis. |
| 7 | Mar 10, 2009 | +6.37% | Seen as the beginning of the post-financial crisis bull market. |
| 8 | Mar 2, 2020 | +4.60% | Short-term rally amid COVID-19 volatility. |
| 9 | Apr 6, 2020 | +7.03% | Optimism around slowing COVID cases and policy support. |
| 10 | Sep 30, 2008 | +5.42% | Rebound after Congress rejected the first bank bailout bill. |
S&P 500 Largest Daily Gains 1926-present (%)
| Rank | Date | Gain (%) | Context |
| 1 | Mar 15, 1933 | +16.61% | Banking crisis eased after FDR’s Emergency Bank Act. |
| 2 | Oct 6, 1931 | +14.87% | Volatility during Great Depression banking crisis. |
| 3 | Sep 5, 1939 | +11.94% | War relief rally after WWII outbreak in Europe. |
| 4 | Oct 13, 2008 | +11.58% | Global financial crisis – coordinated bank rescue. |
| 5 | Oct 21, 1987 | +9.10% | Post–Black Monday bounce. |
| 6 | Mar 24, 2020 | +9.38% | COVID-19 stimulus optimism. |
| 7 | Oct 28, 2008 | +10.79% | Financial crisis volatility. |
| 8 | Mar 4, 1933 | +9.52% | Optimism ahead of FDR’s inauguration. |
| 9 | Mar 13, 2020 | +9.29% | Volatile COVID-era rebound. |
| 10 | Sep 21, 1932 | +9.25% | One of many sharp rallies during Great Depression. |
We don’t bring this up because we have high conviction that we’re heading for a deep reckoning. We may be, but that’s above our pay grade to try and “know” in advance. What we are trying to point out is big one-day gains for equities are actually more common in the context of equity downtrends than uptrends, so we need more corroborating evidence to establish conviction in a bullish reversal. Speed is the weapon of the Bear as it is well understood that investors feel investment losses similarly to feeling pain and it evokes a fight or flight response in the brain. Bull markets, by contrast, are founded on optimism and are characterized by stability and persistency. We think understanding the behavioral underpinnings of the market action is important for analyzing and making sense out of equity price action.
Tactical Levels to Watch
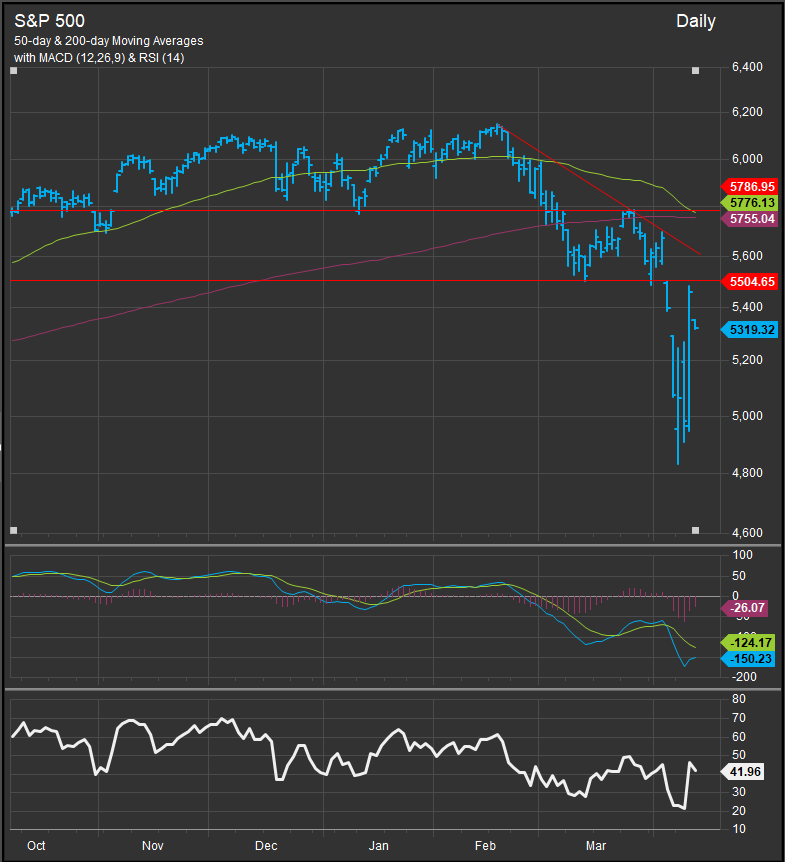
The daily chart of the S&P 500 (below) shows how we’re thinking about the potential for bullish reversal in equities. We have 3 levels that are important to watch for bullish “tells” in the near-term price action. The first is 5504 which is the bottom of the bottom of the first bearish “price gap” in April. 5600 is the next level the bull needs to take out as it represents downtrend resistance. Finally, we think a move above 5786 would be technically significant in the context of a bullish reversal as it is horizontal resistance and currently functions as the “neckline” of a distributional pattern for the index.
We’d also like to see our oscillator studies confirm with the MACD signal line (chart below, panel 2, blue line) crossing above the reference line (green) and our RSI study moving above March highs at the 50-level (chart, bottom panel).