March 31, 2025
We introduced the Elev8 Sector Rotation Model in June of 2024. Here’s a look under the hood at the inputs we use to score the 11 GICS Sectors for April and our resulting positions. The model includes up to 14 indicators that range from:
- Stock Level Technical Characteristics
- Macro-overlays:
- equity trend (S&P 500)
- interest rate trend (10yr US Treasury Yield)
- commodities trend (Bloomberg Commodities Index)
- USD trend (vs. EUR & Broad Currency Indices)
- Relative performance vs. the benchmark S&P 500
- Overbought/Oversold oscillator studies
We use the largest passive sector-based ETF by AUM ($) for each sector as our proxy for Elev8 sector positions. We select 8 out of 11 Sectors each month and have no exposure to the 3 with the lowest scores in our model.
Elev8 Model Input Scores: April 2025
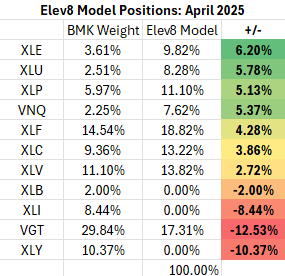
The table below shows the model’s scores for April. Energy, Utilities, Real Estate, Staples and Financials scored the highest based on our inputs. We remain underweight the Technology Sector for a third straight month. The sector had the second lowest score on our dashboard (see below), but we have declined to make it a 0-weight sector as we are uncomfortable with the amount of tracking error we would be exposed to in that scenario. As is, we have zero-weight exposures in Materials, Industrials and Discretionary stocks this month.

Key: Pattern = L/T (1yr+) Price Pattern of the Sector ETF, Mean Rating = simple average of 1-6 ratings (buyàsell) of all stocks within the sector, WTD Mean Rating = Cap Weighted Sector Constituent rating, OB = Overbought, OS = Oversold, N=Neutral
Model Input Commentary
We are seeing broad signs of rotation away from Mega-Cap. Growth stocks and Growth themes in general towards Value, Income and Min Vol. factor exposures. In a sector context that’s a rotation to Staples, Utilities, Healthcare and Real Estate as well as commodity-linked sectors and Financials. We’ve seen continued emergence of recessionary dynamics in positioning and the economic data releases have been softer in aggregate to start 2025 as well. The biggest issue for equities is that the Trump administrations tariff proposals complicate the Fed’s options for supporting the economy.
At the macro level, the path of least resistance for US equities is clearly lower in the near-term. We are concerned that rates remain in a sideways trajectory as that has kept pressure on the consumer. Rising commodities prices haven’t helped and are now getting some tailwind from weakening USD. Given headwinds to mega cap. Growth stocks, we are positioned for a more downside in April.
NOTE: We do have a logistical constraint to our portfolio. We instituted a base $10,000 cash portfolio alongside our model to track and model trading costs. Because of this, we don’t always have the ability to precisely match the model scores to the fund’s weighting position.
Elev8 Sector Rotation Model Portfolio: April Positioning vs. Benchmark Simulated S&P 500

Previous Positioning as of last Rebalance: February 28, 2025

We are positioned to be overweight across the spectrum of lower vol. sectors for April as we see momentum unabated to the downside in the near-term. Bullish catalysts are likely to materialize in the form of concessions on proposed tariff policy, but we haven’t seen any of that materialize heretofore. The S&P 500 remains in a corrective phase with near-term momentum behind defensive areas of the domestic equity market and flows going overseas.
Conclusion
Does anyone remember AI optimism from 3 months ago? It’s been a rough slog for equity investors in 2025. Unpredictability has replaced what now seem like pedestrian concerns about a flagging expansion and a Fed that might not be dovish enough to support it. Now we’re looking for some clues as to the maximum downside from tariff implementation and a potential shake-up of global alignments as the Trump Administration continues to flex its influence in the Geo/Political realm. We start the month cautious and looking for some cracks in downside momentum. For the moment, equities are a falling knife.
Data from Factset Research Systems Inc.
