

March 31, 2026
ELEV8 Model Input Scores: April 2026
The table below shows the ELEV8 model’s scores for April. March’s big developments revolved around the initiation and escalation of military conflict in the Middle East between Iran, Israel and the US. The resultant oil price spike has been a boon to Energy exposures while the upwards pressure on interest rates has put other sectors in rotation. The macro backdrop has become a relatively unusual one relative to history. In the near-term we have concurrent upwards pressure on USD and commodities prices. The former has been supported by rising rates which in turn have been spurred by the mix of tariff implementation and conflict in the Middle East which have put persistent upwards pressure on Commodities prices in 2026.
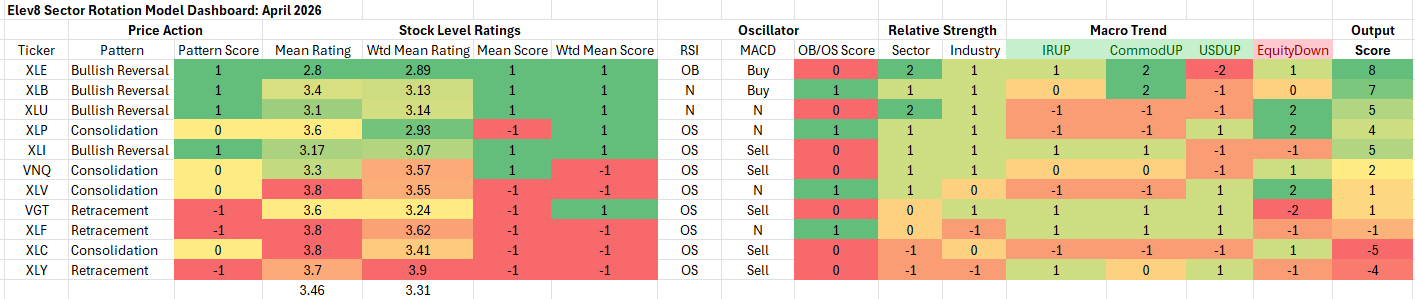
Key: Pattern = L/T (1yr+) Price Pattern of the Sector ETF, Mean Rating = simple average of 1-6 ratings (buy/sell) of all stocks within the sector, WTD Mean Rating = Cap Weighted Sector Constituent rating, OB = Overbought, OS = Oversold, N=Neutral
Model Input Commentary
Stock level signals support continued rotation away from Growth and Cyclicality and towards Commodities and lower volatility sectors. Most of the US equity market is oversold, but we’re seeing bullish setups for Materials and Industrials sectors as the calendar flips to April. Rising rates have kept investors from stampeding into low vol. stocks, but the technicals have improved there YTD. Elev8 is primarily allocating to Commodities and low vol. sector exposures again in April. Potential downside drivers are in focus for investors while the bull case is conceptually clear (war ends quickly, shipping ramps up), but the details are murky at best regarding a potential off-ramp. What keeps us on the skeptical side is Iran’s unilateral ability to keep the Strait of Hormuz blocked. We’d expect that dynamic will be leveraged around any negotiations towards a ceasefire and normalization of trade.
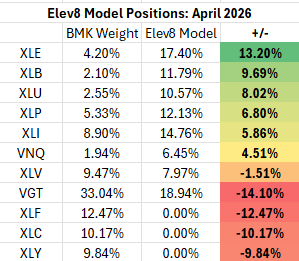
ELEV8 Sector Rotation Model Portfolio: April Positioning vs. Benchmark Simulated S&P 500 (data as of 3/30/2026)
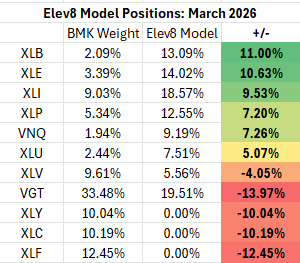
Previous Positioning as of last Rebalance: February 26, 2026
The model rolls over a similar set of exposures from March into April. Inflation and recession risk are likely to be an investor focus if Oil prices remain high. We’re also seeing interest rates creep back up and pressure the consumer and the domestic housing market.
Performance vs. S&P 500 Simulated BMK, March 2026
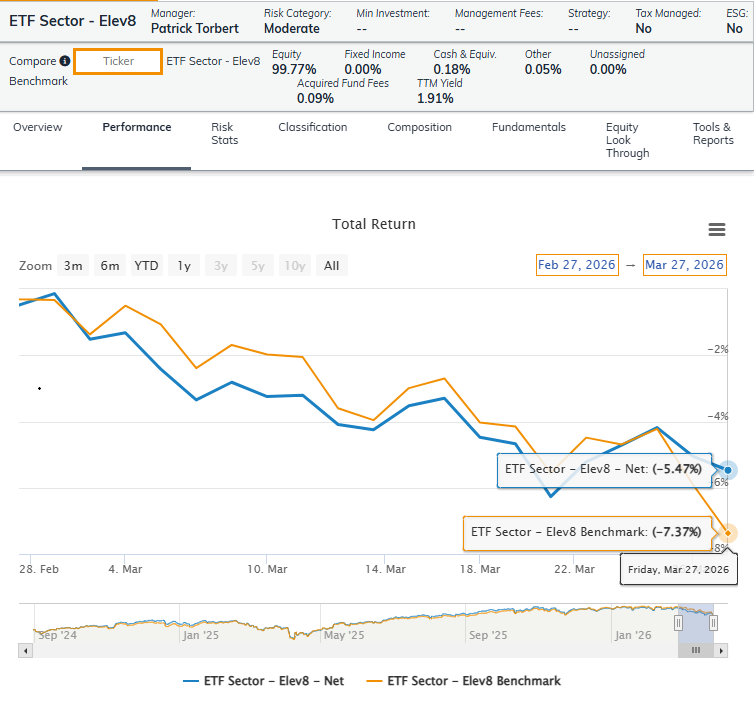
Elev8 was on the right side of the market in March as Energy and Low vol. exposure outperformed despite some periodic buyer interest in Technology and Financial shares throughout the month. Discretionary stocks remain the most vulnerable and we are expecting inflation dynamics to continue to sideline the Growth trade in the near-term. The Elev8 model outperformed our S&P 500 simulated benchmark by +207bps in March and has flipped back to positive performance vs. the S&P 500 over the life of the model.
Conclusion
Investors have been given reason for concern with Crude prices up sharply and interest rates moving higher as well. Late cycle economic dynamics continue to solidify. From a technical perspective, Growth stocks have washed out in the near-term and investors are looking for the next shoe to drop as conflict deepens in the Middle East. We’re expecting a selling climax in the near-term, but tactically that still adds up to starting April on a defensive footing in our sector allocation framework.
About ELEV8
We introduced the ELEV8 Sector Rotation Model in May of 2024. Here’s a look under the hood at the inputs we use to score the 11 GICS Sectors and our resulting positions. The model includes up to 14 indicators that range from:
- Stock Level Technical Characteristics
- Macro-overlays:
- equity trend (S&P 500)
- interest rate trend (10yr US Treasury Yield)
- commodities trend (Bloomberg Commodities Index)
- USD trend (vs. EUR & Broad Currency Indices)
- Relative performance vs. the benchmark S&P 500
- Overbought/Oversold oscillator studies
We use the largest passive sector-based ETF by AUM ($) for each sector as our proxy for ELEV8 sector positions. We select 3 out of 11 Sectors each month and have no exposure to the 8 sectors with the lowest scores in our model.
Data from Factset Research Systems Inc.
