


Elev8 Sector Rotation Model Portfolio: January Positioning
We introduced the Elev8 Sector Rotation Model in June. Here’s a look under the hood at the inputs we use to score the 11 GICS Sectors for January and our resulting positions. We’ve streamlined the model slightly since inception to include up to 14 indicators that range from stock level technicals, macro-overlays for equity trend, interest rate trend, commodities trend and USD trend, relative performance vs. the benchmark S&P 500 and overbought/oversold oscillators.
We use the largest passive sector-based ETF by AUM ($) for each sector as our proxy for Elev8 sector positions. We select 8 out of 11 Sectors each month and have no exposure to the 3 with the lowest scores in our model.
Elev8 Model Input Scores: January
The table below shows the model’s scores for January. Communication Services, Financials, Discretionary and Technology continue as overweight positions. Complimenting that core exposure are overweight positions in Industrials and Energy Sectors are a hedge against deep near-term oversold conditions. We are most under exposed to legacy defensive stocks as we are sitting out the Healthcare Sector in January (as we did in December), and our positioning is likely vulnerable to a more significant market correction than we’ve yet seen. However, these sectors scored the lowest in our model. Equities sold off in the final weeks of 2024 as rates moved higher. We’re betting the present set up is viewed as an accumulation opportunity within the context of the long-term bull trend for equities.
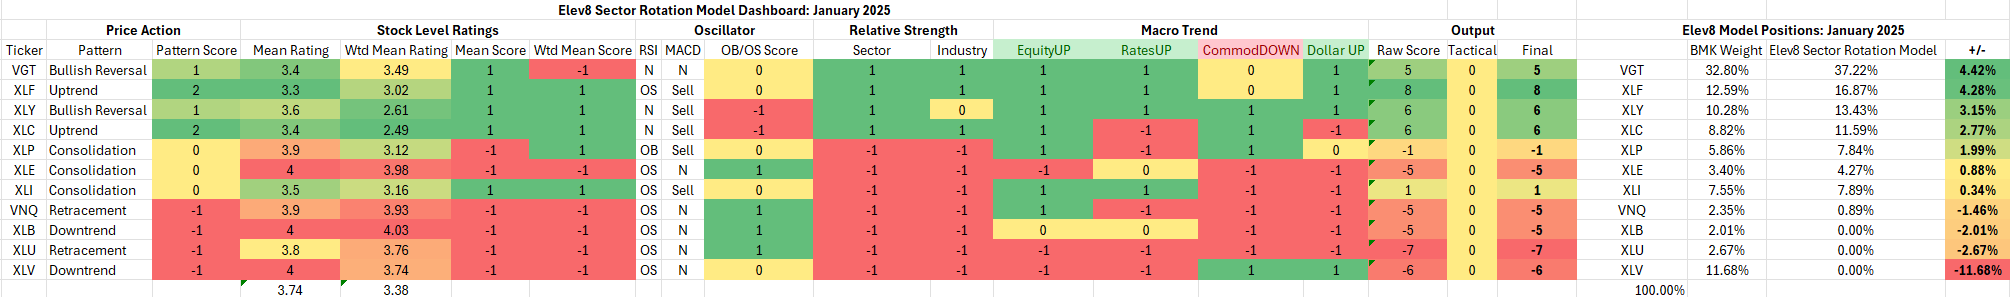
Key: Pattern = L/T (1yr+) Price Pattern of the Sector ETF, Mean Rating = simple average of 1-6 ratings (buysell) of all stocks within the sector, WTD Mean Rating = Cap Weighted Sector Constituent rating, OB = Overbought, OS = Oversold, N=Neutral
Model Input Commentary
With equities strong through November generally, pattern scores have improved broadly as they reflect absolute price. Our “Mean Rating” and “Wtd Mean Rating”, reflect an equal and cap. weighted evaluation of every stock in each sector. They are then scored against the average score across all 11 GICS sectors to get a plus-1, minus-1 input into the scheme. This is the stock level message from each sector. It is confirmed in the model through a higher-level relative strength score at the sector and industry level which is a 3-level scheme (+1, 0, -1). XLP, for example, is buoyed by exceptional performance from just 2 stocks, COST and WMT, but since they are major players, they have an outsized influence on sector performance in aggregate. A similar phenomenon occurs within the Comm. Services Sector as Alphabet, Meta and Netflix wield outsized stock-level influence.
At the macro level, the established trends in place continue to be bullish equities and lower commodities prices. Yields climbed steadily in December and are finally showing some upside exhaustion Given the enduring weakness in commodities prices, we are anticipating yields to move lower this month rather than higher which is a contributing factor to our overall bullish positioning.
Under the “Output” section we have a “Tactical” column that adjusts certain sector scores for dislocations we perceive will affect the market in the near-term. This month we have no tactical overlays, and the raw model scores are the final scores.
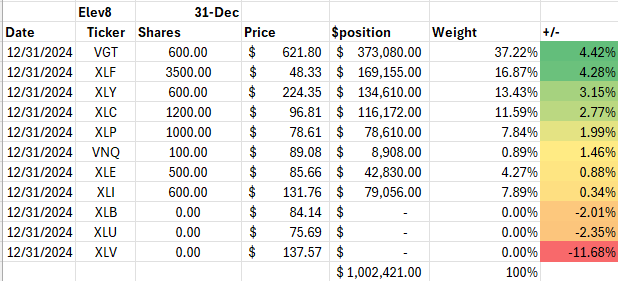
NOTE: We do have a logistical constraint to our portfolio. We instituted a base $10,000 cash portfolio alongside our model to track and model trading costs. Because of this, we don’t always have the ability to precisely match the model scores to the fund’s weighting position. That is a factor in this month’s positioning. VGT has a high share price and the closest way to replicate model positioning was to add 6 shares rather than 5 shares to our cash portfolio. Because of this constraint, VGT is a heavier weight in the portfolio than the model would recommend. This is a replication challenge many small fund’s face in their early stages of asset accumulation.
Elev8 Sector Rotation Model Portfolio: January Positioning vs. Benchmark Simulated S&P 500
Previous Positioning as of last Rebalance: November 30, 2024
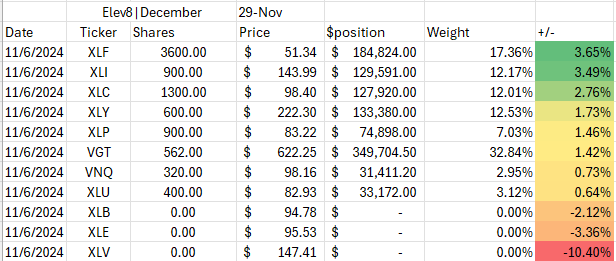
Our core positions remain with Technology, Financials, Discretionary and Comm. Services Sectors as we believe a continued bullish trend in equities will drive outperformance in those sectors. We have covered last month’s short in the Energy sector, and we are just above market weight in our Industrial exposure. Our biggest short is the Healthcare Sector which has underperformed significantly but isn’t showing any positive developments from technical or fundamental lenses. Real Estate and Utilities sectors are in similar positions. We need to see ongoing correction in broad US equities to cover our shorts here absent a clear bullish catalyst emerging.
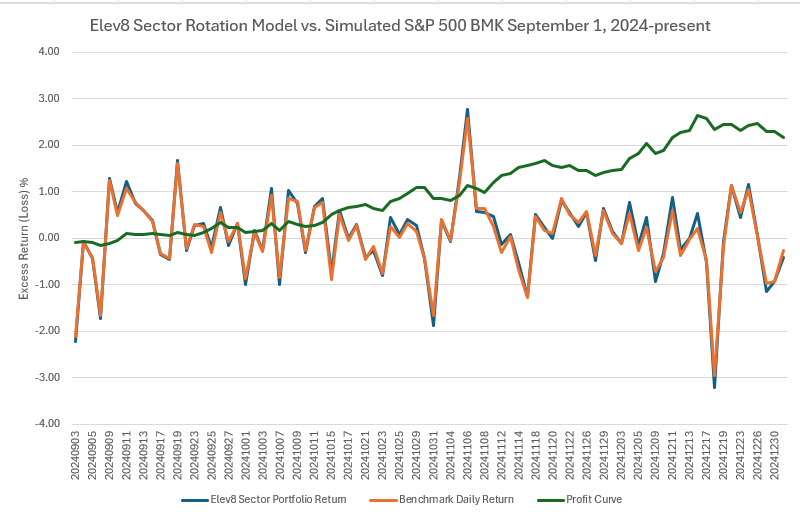
Elev8 Sector Performance: Trailing 4-Months
Since the end of August, the Elev8 Portfolio has outperformed our simulated benchmark by +216 bps. The benchmark replicates the S&P 500 Sector Weights with Large Cap. Sector SPDR Funds that are rebalanced to the S&P Sector weights on the 3rd Friday of March, June, September and December to match the rebalance schedule of the S&P 500 itself. This performance at present, does not include trading costs, but we are working on our cost model presently with plans to debut it into our analysis.
Conclusion
Equities finished 2024 notching consecutive 20% gains. Clearly some good news is priced in, but the question remains whether the economy can expand robustly without triggering inflationary pressures and side-lining a supportive Fed. Our policy makers have already signaled caution, but we are waiting to see an upwards surge in commodities prices before we abandon the long-term bull trend and the sectors which typically outperform during expansions. December ended with a sell-off of 5% for the S&P 500, but that has alleviated overbought conditions which were present at mid-month. We are taking an optimistic view of the present setup to start 2025 and have our largest overweight positions in Technology, Financials, Discretionary and Consumer Discretionary stocks to start the new year.
Data from Factset Research Systems Inc.
