Elev8 Model Input Scores: January 2025
The table below shows the Elev8 model’s scores for January. The big development in December was a cooler CPI print on the back of the Fed’s rate cut. The combination of the two events drove rotation towards cyclical positioning despite equities entering the month in a somewhat vulnerable position with S&P 500 internals weakening and interest rates and commodities prices firm to start the month. The cooler inflation print sparked a rally that took the S&P 500 to new highs during December confirming the equity uptrend. The Utilities sector bore the brunt of the near-term selling pressure while min vol. stocks generally sold off into mid-month as the combination of a supportive Fed and easing inflation prompted investors to be on continued business cycle expansion.
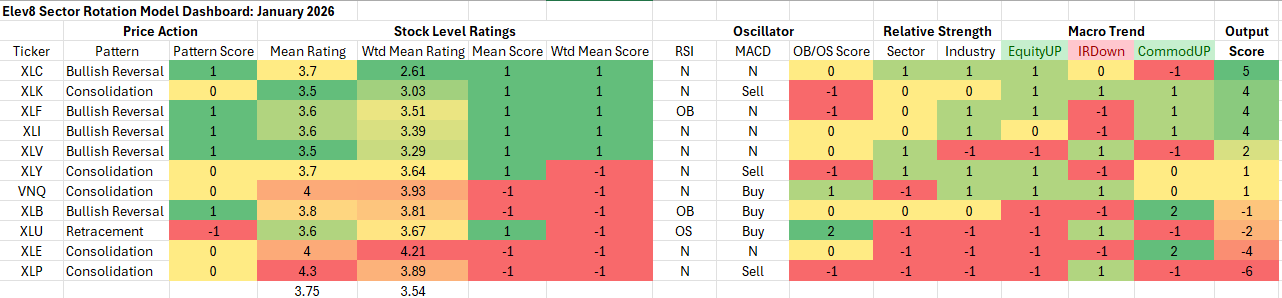
Key: Pattern = L/T (1yr+) Price Pattern of the Sector ETF, Mean Rating = simple average of 1-6 ratings (buyàsell) of all stocks within the sector, WTD Mean Rating = Cap Weighted Sector Constituent rating, OB = Overbought, OS = Oversold, N=Neutral
Model Input Commentary
A mix of Growth and Cyclical exposures scored the highest in our model for January. Alleviation of inflation concerns shifts the outlook for equities dramatically in theory. Now with a supportive Fed, falling inflation and an economy near full employment, consumers have some reason for optimism. Will we see rates move low enough to thaw the housing market or spur a hiring cycle? Those planks of the bullish case are potentially back on line now that inflation concerns have abated. Potential headwinds include continued supply chain and capacity issues due to global trade realignment, enduring high prices and tight labor markets, a bifurcated economy that is concentrating wealth and continued concerns about AI-related valuations.
Given that we are in late cycle, the time for big sector bets is likely past absent a clear dislocation in market pricing. We’re starting 2026 with our bets fairly tight to the benchmark as a new calendar year often comes with a different set of impulses than the previous one. We remain constructive on equities into 2026. If 2025 was the year that inflation failed to materialize, 2026 is likely to be the year where AI proves its value or proves it is a speculative bubble.
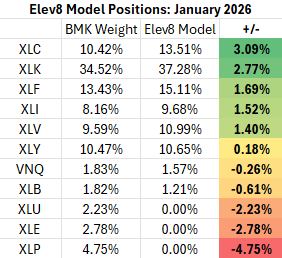
Elev8 Sector Rotation Model Portfolio: January Positioning vs. Benchmark Simulated S&P 500 (data as of 12/30/25)
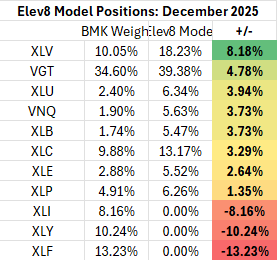
Previous Positioning as of last Rebalance: November 26, 2025
With inflation concerns taking a backseat after the cooler December CPI print our defensive tactical overlay from December has been removed. Our trend following model has shifted to a modestly pro-cyclical stance. With interest rates expected to be stable in the near-term, we think discounted Mega Cap. Growth names with strong earnings will be seen as an accumulation opportunity in early 2026. That said, we expect monetizing AI tools will be the next leg of the bull market. AI will need to prove its worth as a profit catalyst to maintain the enthusiasm and rich valuations for companies operating in that eco-system. The Elve8 portfolio is positioned to succeed if equities continue on a positive trajectory in January. Renewed inflation concerns and/or soft data would likely be a headwind to performance.
Conclusion
Given that we are in late cycle, the time for big sector bets is likely past absent a clear dislocation in market pricing. We’re starting 2026 with our bets fairly tight to the benchmark as a new calendar year often comes with a different set of impulses than the previous one. We remain constructive on equities into 2026. If 2025 was the year that inflation failed to materialize, 2026 is likely to be the year where AI proves its value or proves it is a speculative bubble.
About Elev8
We introduced the Elev8 Sector Rotation Model in January of 2024. Here’s a look under the hood at the inputs we use to score the 11 GICS Sectors for April and our resulting positions. The model includes up to 14 indicators that range from:
- Stock Level Technical Characteristics
- Macro-overlays:
- equity trend (S&P 500)
- interest rate trend (10yr US Treasury Yield)
- commodities trend (Bloomberg Commodities Index)
- USD trend (vs. EUR & Broad Currency Indices)
- Relative performance vs. the benchmark S&P 500
- Overbought/Oversold oscillator studies
We use the largest passive sector-based ETF by AUM ($) for each sector as our proxy for Elev8 sector positions. We select 8 out of 11 Sectors each month and have no exposure to the 3 with the lowest scores in our model.
Data from Factset Research Systems Inc.
