February 28, 2025
We introduced the Elev8 Sector Rotation Model in June of 2024. Here’s a look under the hood at the inputs we use to score the 11 GICS Sectors for January and our resulting positions. We’ve streamlined the model slightly since inception to include up to 14 indicators that range from stock level technicals, macro-overlays for equity trend, interest rate trend, commodities trend and USD trend, relative performance vs. the benchmark S&P 500 and overbought/oversold oscillators.
We use the largest passive sector-based ETF by AUM ($) for each sector as our proxy for Elev8 sector positions. We select 8 out of 11 Sectors each month and have no exposure to the 3 with the lowest scores in our model.
Elev8 Model Input Scores: March 2025
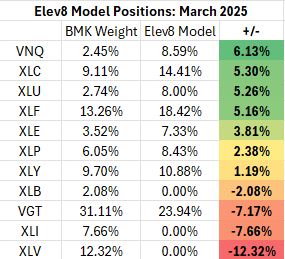
The table below shows the model’s scores for February. Financials, Comm. Services, Real Estate and Utilities Sectors scored the highest for March across our suite of indicators. We remain underweight the Technology sector for a second straight month. The sector had the lowest score in our dashboard (see below), but we have declined to make it a 0-weight sector as we are uncomfortable with the amount of tracking error we would be exposed to in that scenario. As is, we have zero-weight exposures in Materials, Industrials and Healthcare this month along with an underweight allocation to the Technology sector.
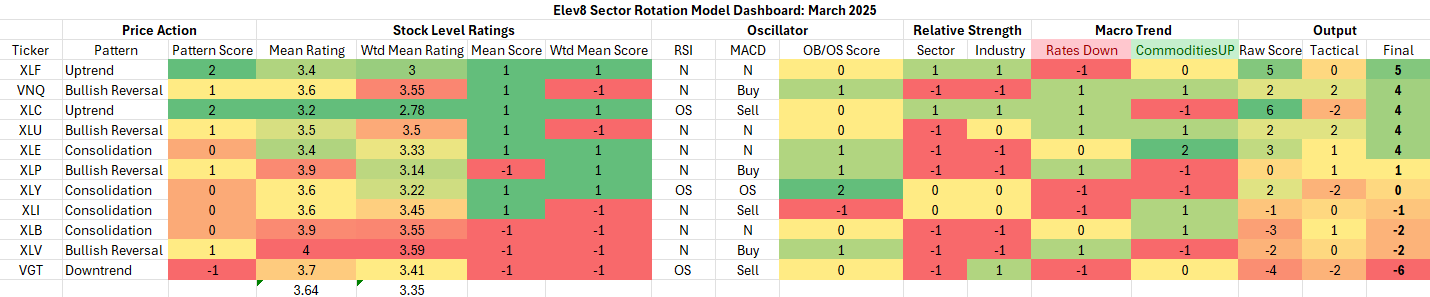
Key: Pattern = L/T (1yr+) Price Pattern of the Sector ETF, Mean Rating = simple average of 1-6 ratings (buyàsell) of all stocks within the sector, WTD Mean Rating = Cap Weighted Sector Constituent rating, OB = Overbought, OS = Oversold, N=Neutral
Model Input Commentary
We are seeing broad signs of rotation away from Mega-Cap. Growth stocks and Growth themes in general towards Value factor exposures. In a sector context that accounts for our tactical scores favoring commodity-linked, low vol. and cyclical sectors over those with Mag7 constituents. That said, commodities prices have rolled over in the near-term and key industries within the Industrials sector like Construction & Engineering and Building Products continue to deteriorate over the intermediate-term. Our positioning for March straddles defensive and cyclical Value exposures. We aren’t expecting a huge boom in inflationary dynamics, but we think there is mounting evidence the Consumer is in need of some assistance and the AI hype train is flagging as well. This opens the door for consolidation in the near-term as investors look for the next catalyst.
At the macro level we are seeing consolidation in the near-term for equities, while commodities move higher and rates lower. Tariff dynamics have added a whiff of the recessionary to the macro picture. The S&P 500 long-term uptrend has lost momentum since December despite some marginal new all-timer highs in 2025. The yield on the 10yr Treasury remains above the 4.2% level which isn’t what anyone had in mind when they were bidding equities higher last September-November. The USD upside break-out has paused, and, while commodities prices have risen with tariff “jawboning” a daily news fixture, they recently rolled over at resistance and Materials stocks for the most part aren’t showing setups that make us think bullish trend change is imminent.
NOTE: We do have a logistical constraint to our portfolio. We instituted a base $10,000 cash portfolio alongside our model to track and model trading costs. Because of this, we don’t always have the ability to precisely match the model scores to the fund’s weighting position.
Elev8 Sector Rotation Model Portfolio: March Positioning vs. Benchmark Simulated S&P 500
Previous Positioning as of last Rebalance: January 31, 2025
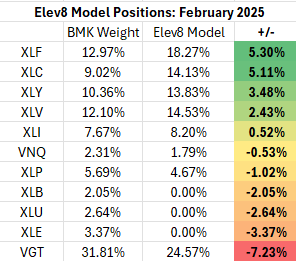
We continue with an underweight exposure to Technology Sector shares. Financials and Comm Services Sectors continue to grade out as the strongest exposures in our work, but we are expecting further corrective action for equities in March. NVDA’s earnings report and the market reaction showed that much of the good news is “priced in”, and we need new upside surprises to keep the fervor stoked. Our analysis of the US equity market’s technical characteristics shows buying fatigue based on a number of developing negative momentum divergences for key stocks and themes like the Mag7 names, Homebuilders, Semiconductors and Building Products stocks to name a few.
Conclusion
The current bull trend for equities was born on a powerful wave of AI optimism. After 2 years that catalyst has matured and is now tiring and investors are looking for what’s next. We think the current setup shows elevated potential for a correction in equity prices. AI companies have been priced for successful outcomes, but economic data is sending conflicting messages while inflation and high prices remain with us. Long story short, the US equity market has priced in a lot of bullish promises around AI, economic “Soft Landing” and the re-emergent Greatness of America. Reality needs to deliver.
Data from Factset Research Systems Inc.