We introduced the Elev8 Sector Rotation Model in June. Here’s a look under the hood at the inputs we use to score the 11 GICS Sectors for October. We’ve streamlined the model slightly since inception to include up to 14 indicators that range from stock level technical characteristics, macro-overlays for equity trend, interest rate trend, commodities trend and USD trend, relative performance vs. the benchmark S&P 500 and overbought/oversold oscillators. The below positioning changes will take place EOD Monday, September 30th.
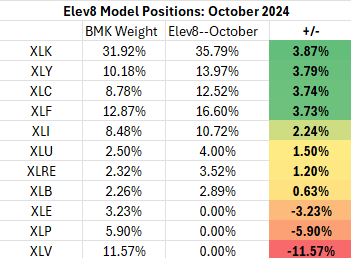
Elev8 Sector Rotation Model Portfolio: October Positioning
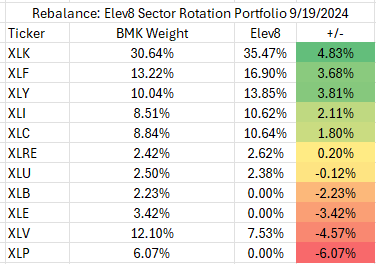
Previous Positioning as of last Rebalance: September 19, 2024
Our month end review of our 14 Elev8 Sector Rotation Model inputs results in a paring of our long exposure in XLK and increasing exposure to XLC. We’ve gone long XLB on improving stock level technical characteristics and we have added to our XLU position after some near-term consolidation at the end of September from the sector. On the short side, we moved from a tactical short to zero weight in XLV resulting in our biggest underweight of -11.57%. We continue zero weight exposures to XLP and XLE.
At a high level this month’s allocation leaves us exposed to underperformance risk from a macro scenario of downside correction in equities with rates moving lower. We are also negatively exposed to any potential spike in Oil prices in the near-term. In exchange for those risks, we are positioned for a continued bullish expansion that we expect will resemble pre-pandemic deflationary Growth regimes. We are aligned with historical beneficiaries of rising equity prices and falling interest rates. We also continue to like Financials as a reflationary play from their trough in 2023. Please read through our model input commentary for details.
NOTE: Those with a sharp eye will note our positioning doesn’t quite lineup with our theoretical model scores. This is because the positions are determined by our research portfolio which is a $10,000 cash portfolio. So, for example, rather than the model prescribed 1562.8 shares of XLK, we have 16 shares of XLK in the portfolio and instead of 742 XLY shares, we have 7. In the well-founded interest of full disclosure, that’s what you are seeing.
Model Inputs/Outputs: October
The table below shows the model’s scores for October. Consumer Discretionary (XLY) and Financials (XLF) have the highest scores followed by Technology (XLK) and Communications Services (XLC) sectors. Energy (XLE), Healthcare (XLV) and Consumer Staples (XLP) have our lowest scores this month and are zero weights in our 8-sector allocation model.
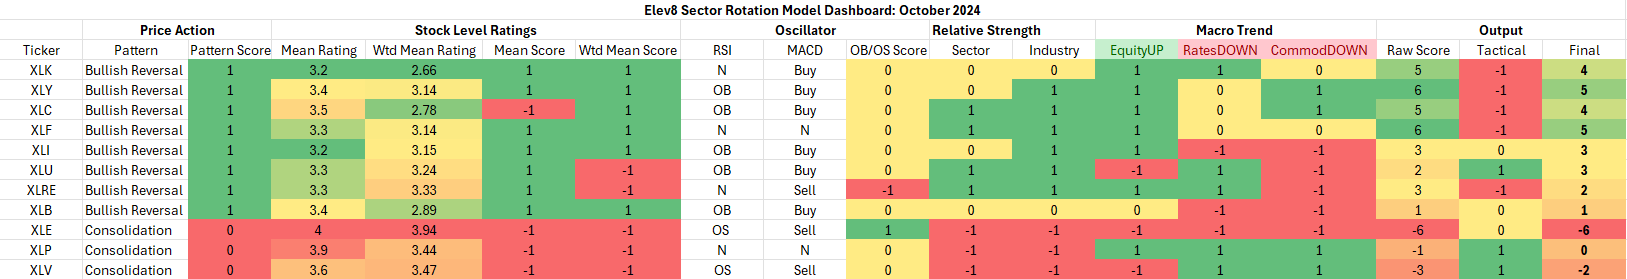
Key: Pattern = L/T (1yr+) Price Pattern of the Sector ETF, Mean Rating = simple average of 1-6 ratings (buyàsell) of all stocks within the sector, WTD Mean Rating = Cap Weighted Sector Constituent rating, OB = Overbought, OS = Oversold, N=Neutral
Model Input Commentary
With equities strong in September generally, pattern scores have improved broadly as they reflect absolute price. Our “Mean Rating” and “Wtd Mean Rating”, reflect an equal and cap. weighted evaluation of every stock in each sector. They are then scored against the average score across all 11 GICS sectors to get a plus-1, minus-1 input into the scheme. This is the stock level message from each sector. It is confirmed in the model through a higher-level relative strength score at the sector and industry level which is a 3-level scheme (+1, 0, -1).
This month will be pivotal to XLK for example. From a technical perspective it still boasts the best long-term chart patterns. This is balanced against neutral relative strength scores as the sector has consolidated over the intermediate term (3-9 months). If the prevailing trend endures, this should be a strong accumulation point for XLK. Our trend following process gives the benefit of the doubt to the prevailing long-term trend when macro conditions are supportive, and stock charts broadly remain above support levels we use to evaluate trend change.
At the macro level, the established trends in place continue to be bullish equities, lower yields and lower commodities prices. We note that Commodities prices are rallying from deeply oversold conditions, but the downtrend price structure has us fading strength there until proven otherwise.
Under the “Output” section we have a “Tactical” column that adjusts certain sector scores for dislocations we perceive will affect the market in the near-term. Seasonality continues to be a bearish tactical overlay heading into October.
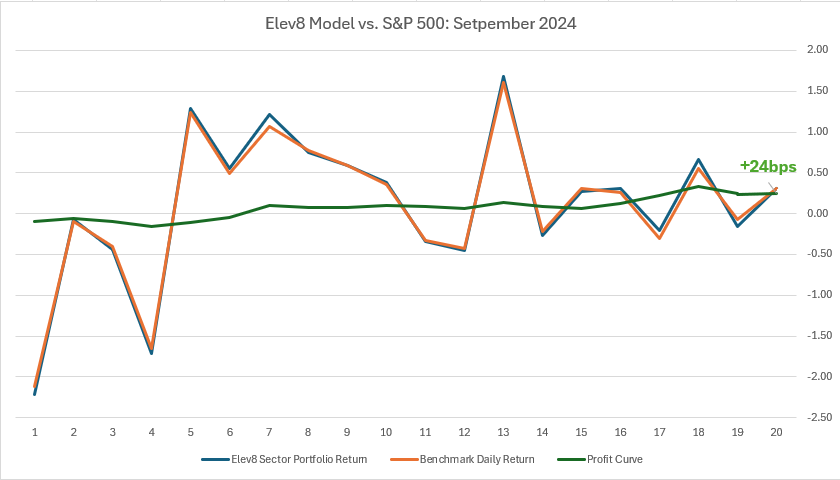
September Performance Recap: +24 bps
We note in our early days operating an actively managed sector rotation portfolio of Large Cap. sector SPDR’s that we may need to tweak our process to take bigger bets. In a past life as a bottoms-up stock-picker, a sector dispersion similar to our ETF model could swing a portfolio to an excess return or loss of a few hundred bps per month. We have seen a little more than a tenth of that much dispersion in our excess returns positive or negative since beginning to run the model portfolio June 1, 2024. This month the model outperformed by 24bps on the month. We rebalanced one time on the September 18th close after the Fed’s policy announcement. Our profit curve was as follows.
Conclusion
September saw equities strengthen as the Fed delivered on a dovish policy shift with a 50 bp rate cut and guidance for more into year end. With interest rates falling and the S&P 500 achieving a new all-time high in September, the bull trend is confirmed for October. Despite historically bearish seasonals, we start the month positioned for continued upside in equities prices. Please be on the lookout for ETFSector.com’s monthly Sector Insights and S&P 500 Outlook reports which will be posting over the next 36 hours.
