May 2, 2025
We introduced our Elev8 model in June of 2024 and have been running it in its current form since August 28, 2024. Each month we review the previous month’s positioning and performance to identify what worked and what needs improvement. A brief description of the Elev8 model and its inputs follows the review as an appendix.
Elev8 Model Indicator Dashboard & Positions (April 2025)

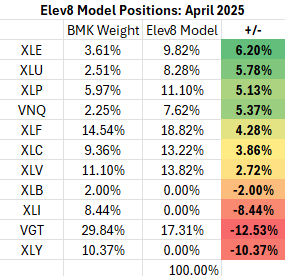
Key: Pattern = L/T (1yr+) Price Pattern of the Sector ETF, Mean Rating = simple average of 1-6 ratings (buyàsell) of all stocks within the sector, WTD Mean Rating = Cap Weighted Sector Constituent rating, OB = Overbought, OS = Oversold, N=Neutral
Performance Recap: Elev8 Performance vs. Benchmark (April 2025)
Elev8 Model: -2.36% Elev8 Benchmark (Simulated S&P 500): -0.98%
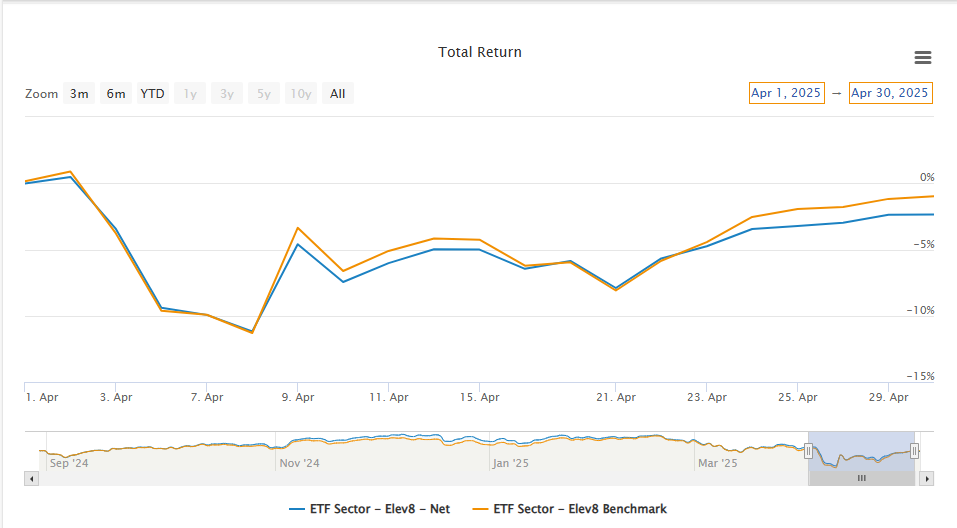
Note: Portfolio Attribution and charting sourced from ETFAction
Performance Recap: Elev8 Performance vs. Benchmark (Sept. 1, 2024 – April 30, 2025)
Elev8 Model: -0.54% Elev8 Benchmark (Simulated S&P 500): -0.28%
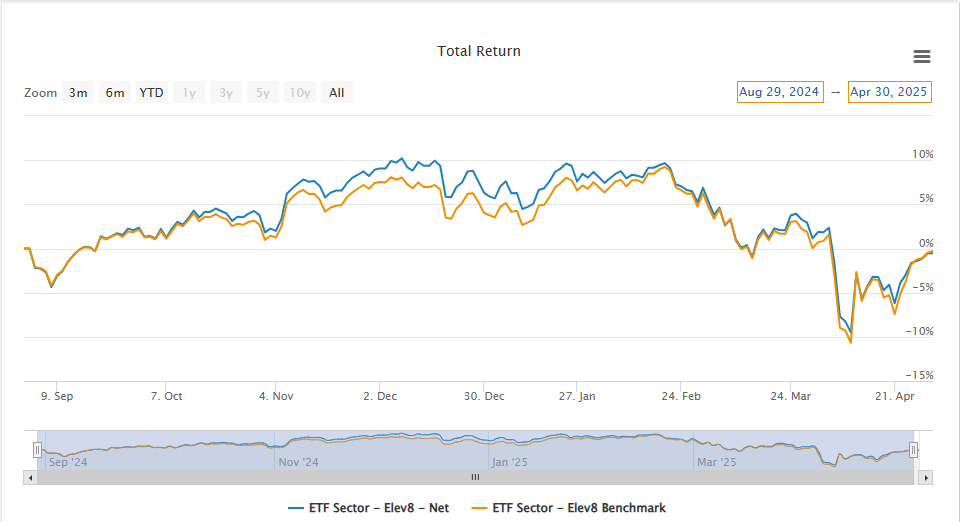
Note: Portfolio Attribution and charting sourced from ETFAction
What Worked in April
Equities started the month in decline and our defensive positioning outperformed through the first 2 weeks of April. Our overweight positions across low vol. sectors, Staples, Utilities, Real Estate and Healthcare outperformed through April 21. However, bullish (or less bearish) developments on global trade emerged and investors shifted to accumulating risk-on exposures where we were short.
What didn’t work in April
We entered the month underweight the Information Technology Sector and overweight the Energy sector. Both were mistakes in hindsight, but we feel like the miss on Energy is something we should have done better with. Historically Energy does well when commodities prices are outperforming equities, as they were going into April. What we didn’t incorporate into our thinking was the relatively new fact (our studies draw data back to 1980) that the US is a net petroleum exporter and the sector was vulnerable to additional exogenous shocks from the trade war dynamic.
How We’re Thinking About Solutions
Running a trend following model is a difficult exercise when equities aren’t trending in one direction over a multi-month timeframe. Our monthly rebalance schedule can sometimes be out of synch with pivots in the equity market as was the case in April. The model relies on the presence of momentum to generate alpha. We’re developing some complimentary strategies that integrate long/short funds and volatility funds into our sector fund toolkit. We will be building strategies with those building blocks to enhance our trend following strategy with some hedging characteristics that should make it prone to being whipsawed by volatility.
May Positioning

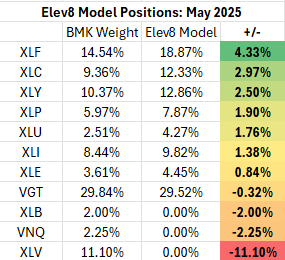
Key: Pattern = L/T (1yr+) Price Pattern of the Sector ETF, Mean Rating = simple average of 1-6 ratings (buyàsell) of all stocks within the sector, WTD Mean Rating = Cap Weighted Sector Constituent rating, OB = Overbought, OS = Oversold, N=Neutral
Appendix: What is the Elev8 Model
Elev8 Model
Elev8 is a sector rotation model that seeks to outperform the S&P 500 on a yearly basis by actively managing sector exposures relative to our simulated S&P 500 benchmark. The model seeks to generate alpha over its benchmark by allocating 100% of the portfolio to 8 of the 11 GICS Sectors comprising the S&P 500. It picks the 8 sectors that have the strongest scores in the model’s up to 14 inputs while having no exposure to 3 of the GICS Sectors that have the weakest scores in the model each month. The model can be above or below benchmark weight in the sectors it does have positions in.
Elev8 Model Inputs
- Stock Level Technical Characteristics
- Macro-overlays:
- equity trend (S&P 500)
- interest rate trend (10yr US Treasury Yield)
- commodities trend (Bloomberg Commodities Index)
- USD trend (vs. EUR & Broad Currency Indices)
- Relative performance vs. the benchmark S&P 500 at the sector and industry level
- Overbought/Oversold oscillator studies