September 3, 2025
We introduced our Elev8 model in June of 2024 and have been running it in its current form since August 28, 2024. Each month we review the previous month’s positioning and performance to identify what worked and what needs improvement. A brief description of the Elev8 model and its inputs follows the review as an appendix.
This August’s recap is a special one for us as it marks our first full year running the Elev8 model vs. our simulated S&P 500 benchmark (Our benchmark uses SPDR funds to replicate S&P 500 sector weights on the same quarterly rebalance schedule as the S&P 500 Index). While the Elev8 Model trailed the benchmark by 30 bps in August, we were able to generate an excess return above the benchmark of 2.55% in our first full year running the Elev8 portfolio.
Elev8 Model Indicator Dashboard & Positions (August 2025)

Key: Pattern = L/T (1yr+) Price Pattern of the Sector ETF, Mean Rating = simple average of 1-6 ratings (buyàsell) of all stocks within the sector, WTD Mean Rating = Cap Weighted Sector Constituent rating, OB = Overbought, OS = Oversold, N=Neutral
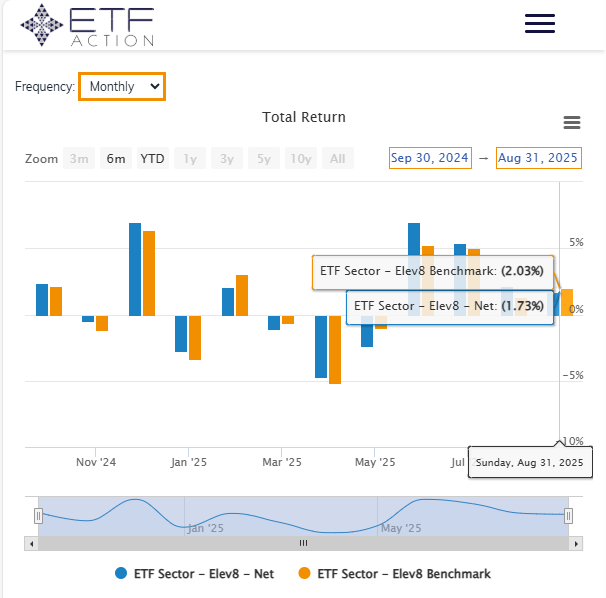
Performance Recap: Elev8 Performance vs. Benchmark (August 2025) -30 bps vs. BMK
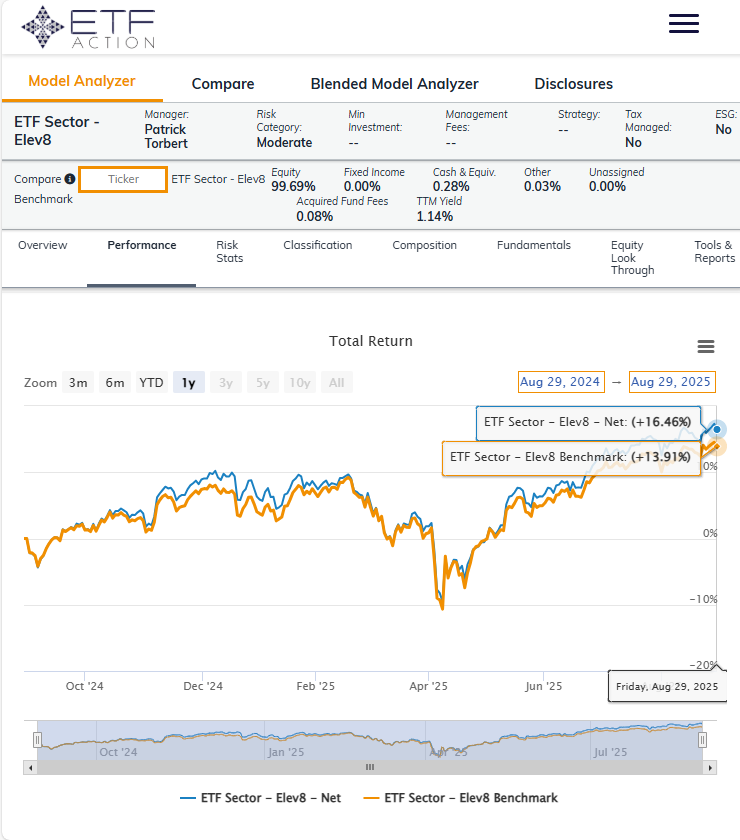
Performance Recap: Elev8 Performance vs. Benchmark (Sept. 1, 2024 – August 31, 2025) +255 bps vs. BMK
What Worked in August
Our general positioning was in line with the market level trend as equities gained ground in August and the Elev8 model had us generally aligned with bullish exposures at a high level. However, we were also the beneficiaries of some good fortune, based on our security selection rules.
We use VGT rather than XLK for our Tech sector positioning. Despite the fact that we were overweight the Tech Sector through a +4.33% overweight in VGT while the XLK underperformed the S&P 500 by 198bps. The VGT, encompassing a broader range of stocks outperformed XLK by 116bps in August and preserving some performance for the Elev8 portfolio.
Our long positions in XLF, XLC and XLE added some alpha on the long side.
What didn’t work in August
We rolled over our short position in XLV (-9.16%), XLB (-1.86%) and VNQ (-2.04%) in August while also going to a tactical underweight in XLY (-.27%). In hindsight, each of those decisions was incorrect. We assumed stable/falling interest rates would continue to support the Growth trade and AI leadership. What transpired was some rotation out of Tech and Industrials (we were long both) and into sectors that had been lagging entering the month. This rotation away from momentum leadership despite a continuing bull trend for equities at the top line caught us offsides.
September Inputs & Positioning
Our model starts September with a tactical short in the Tech Sector while we’ve taken the portfolio out of Staples, and Industrials and rolled over our short in the Materials sector. We think there is increased likelihood of profit-taking in AI themed exposures, but we’re expecting dovish Fed policy to boost the consumer, particularly rate sensitive areas like homebuilding. Staples and Materials stocks face headwinds from tariff implementation while there are signs of momentum divergence in the AI trade which is a signal of potential buyer exhaustion in the near-term. These developments have led us to make tactical calls against Elev8’s trend-following inputs in the Tech Sector and Industrial Sector for September.
Elev8 Model Input Dashboard: September
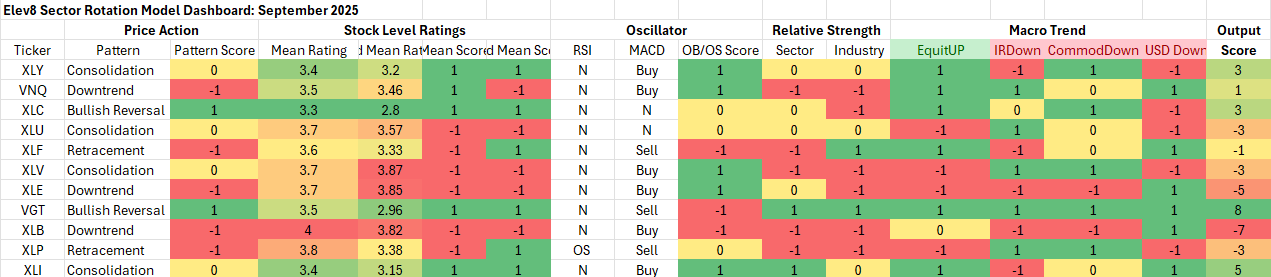
Key: Pattern = L/T (1yr+) Price Pattern of the Sector ETF, Mean Rating = simple average of 1-6 ratings (buyàsell) of all stocks within the sector, WTD Mean Rating = Cap Weighted Sector Constituent rating, OB = Overbought, OS = Oversold, N=Neutral
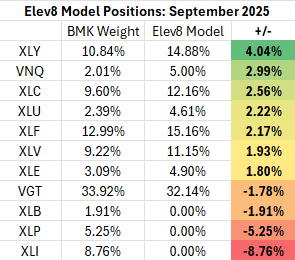
Elev8 Model Positions: September
Sources:
Attribution provided by ETFAction, https://www.etfaction.com/
Other data provided by FactSet Research Systems Inc.
Appendix: What is the Elev8 Model
Elev8 Model
Elev8 is a sector rotation model that seeks to outperform the S&P 500 on a yearly basis by actively managing sector exposures relative to our simulated S&P 500 benchmark. The model seeks to generate alpha over its benchmark by allocating 100% of the portfolio to 8 of the 11 GICS Sectors comprising the S&P 500. It picks the 8 sectors that have the strongest scores in the model’s up to 14 inputs while having no exposure to 3 of the GICS Sectors that have the weakest scores in the model each month. The model can be above or below benchmark weight in the sectors it does have positions in.
Elev8 Model Inputs
- Stock Level Technical Characteristics
- Macro-overlays:
- equity trend (S&P 500)
- interest rate trend (10yr US Treasury Yield)
- commodities trend (Bloomberg Commodities Index)
- USD trend (vs. EUR & Broad Currency Indices)
- Relative performance vs. the benchmark S&P 500 at the sector and industry level
- Overbought/Oversold oscillator studies
