January 8, 2025
We introduced our Elev8 model in June of 2024 and have been running it in its current form since August 28, 2024. Each month we review the previous month’s positioning and performance to identify what worked and what needs improvement. A brief description of the Elev8 model and its inputs follows the review as an appendix.
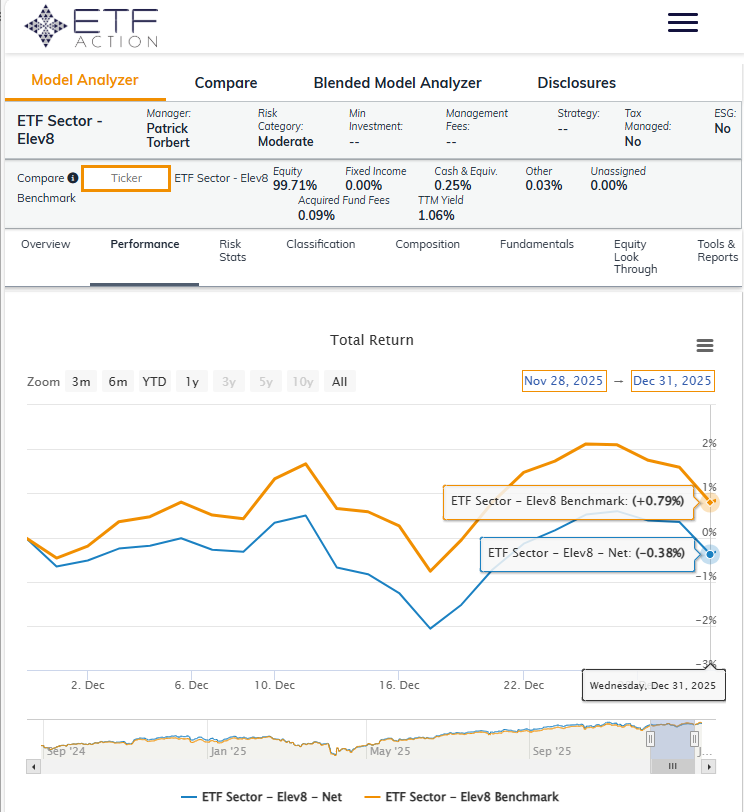
This month saw a misstep on performance as our inflation outlook proved out of step with the print. As a result, the portfolio underperformed in December 2025 posting an excess return of -117 bps vs. our simulated S&P 500 benchmark.
The model got into some trouble once before since inception, back in January-February of this year we underperformed for 2 consecutive months as we now have. This prompts reflection given results contrary to our goals.
Elev8 Model Indicator Dashboard & Positions (December 2025)
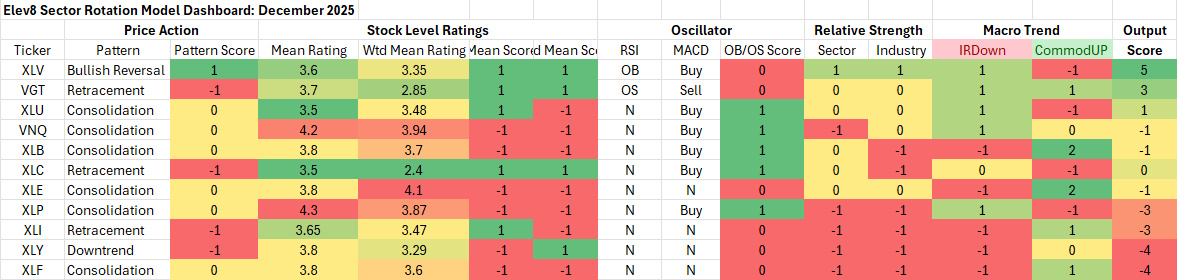
Key: Pattern = L/T (1yr+) Price Pattern of the Sector ETF, Mean Rating = simple average of 1-6 ratings (buyàsell) of all stocks within the sector, WTD Mean Rating = Cap Weighted Sector Constituent rating, OB = Overbought, OS = Oversold, N=Neutral
Performance Recap: Elev8 Performance vs. Benchmark (December 2025)
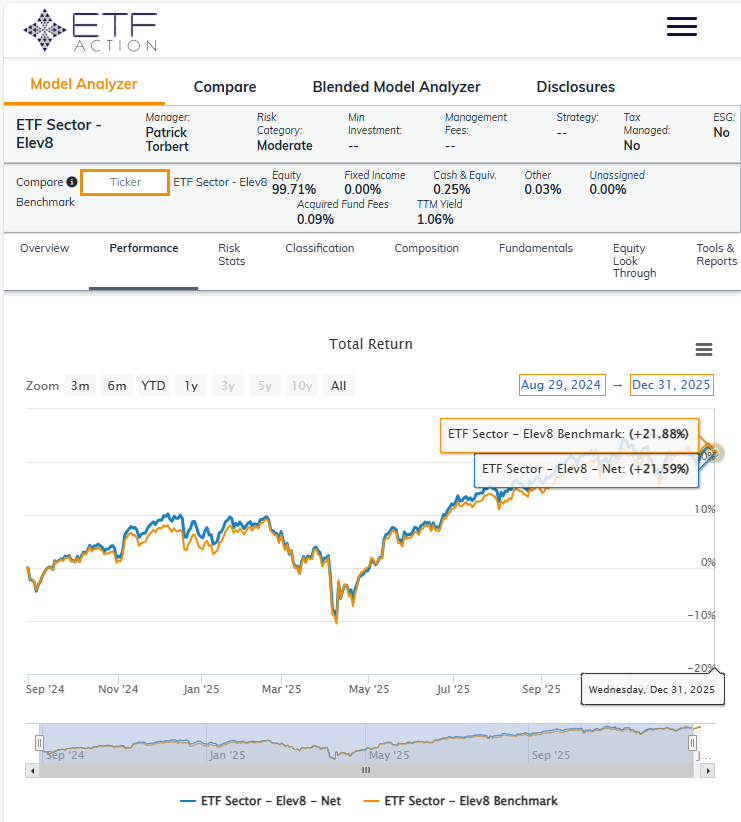
Performance Recap: Elev8 Performance vs. Benchmark (August 29, 2024 – December 31, 2025)
What didn’t work in December
As a trend-following model, Elev8 has an inherent weakness when in the short-term when trends change abruptly. We had seen evidence of uptrend deterioration in our stock level indicators since the end of October as the AI trade consolidated, and into December we saw evidence of rotation into inflation hedges and low vol. sectors while cyclical sectors remained weak. Given the setup of very stable CPI prints near 3%, rising commodities prices and the Fed telegraphing a one-and-done scenario for their December cut, we expected the cut itself to be a “buy the rumor, sell the news” event. However, with the CPI coming in materially softer than consensus, the Fed. has more flexibility and the Consumer potentially has some breathing room as well going forward. We bet against that outcome.
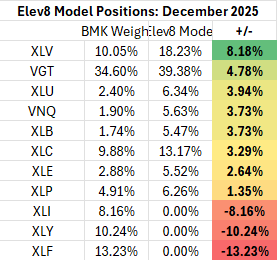
Since we shorted larger sectors (Financials, Discretionary, Industrials), we had one of our highest tracking errors to the benchmark, hence the larger miss than usual.
While these results are short of our expectations, we do think the results illustrate the potential for the model to differentiate and adapt its return profile based on the strategic outlook our analysis provides us.
January Inputs & Positioning
For January we have taken off our downside inflation hedges given clear near-term resolution in the short-term direction of inflation coming off December’s CPI print of 2.7%. Treasury Yields have stayed contained while the S&P 500 printed new all-time highs. Investors rotated strongly into pro-cyclical sectors as the macro picture improved for risk assets. We think if rates stay contained despite the recent risk-on behavior, the setup actually favors Growth exposures rather than Value. That said the current bout of “AI fatigue” is reflected in the stock charts at the core of our process. We are positioning across a broad mix of historically upside exposures as a result.
Elev8 Model Input Dashboard: January
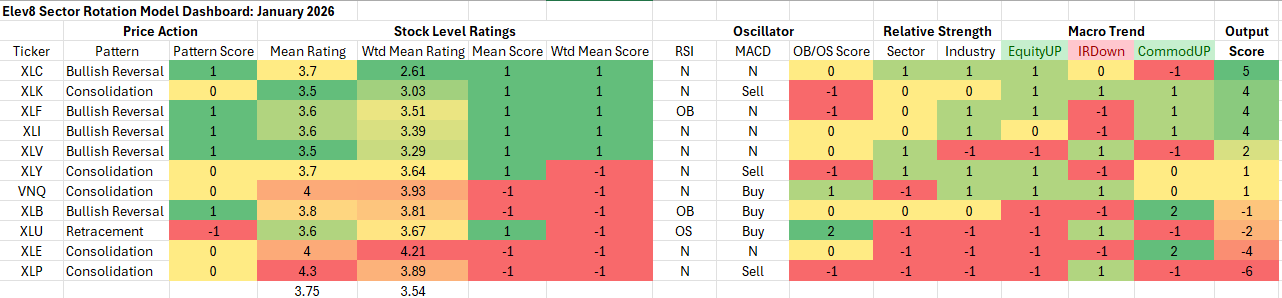
Key: Pattern = L/T (1yr+) Price Pattern of the Sector ETF, Mean Rating = simple average of 1-6 ratings (buyàsell) of all stocks within the sector, WTD Mean Rating = Cap Weighted Sector Constituent rating, OB = Overbought, OS = Oversold, N=Neutral
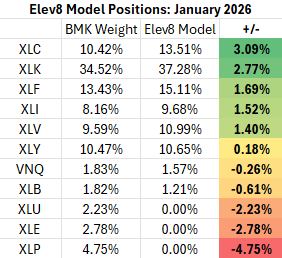
Elev8 Model Positions: January
Attribution provided by ETFAction, https://www.etfaction.com/
Other data provided by FactSet Research Systems Inc.
Appendix: What is the Elev8 Model
Elev8 Model
Elev8 is a sector rotation model that seeks to outperform the S&P 500 on a yearly basis by actively managing sector exposures relative to our simulated S&P 500 benchmark. The model seeks to generate alpha over its benchmark by allocating 100% of the portfolio to 8 of the 11 GICS Sectors comprising the S&P 500. It picks the 8 sectors that have the strongest scores in the model’s up to 14 inputs while having no exposure to 3 of the GICS Sectors that have the weakest scores in the model each month. The model can be above or below benchmark weight in the sectors it does have positions in.
Elev8 Model Inputs
- Stock Level Technical Characteristics
- Macro-overlays:
- equity trend (S&P 500)
- interest rate trend (10yr US Treasury Yield)
- commodities trend (Bloomberg Commodities Index)
- USD trend (vs. EUR & Broad Currency Indices)
- Relative performance vs. the benchmark S&P 500 at the sector and industry level
- Overbought/Oversold oscillator studies
- Tactical Overlays Include: Seasonality, Fiscal & Monetary Policy Interventions, VIX levels, Economic and Earnings alerts and considerations for exogenous events that are seen to be market moving.
