March 3, 2025
We introduced our Elev8 model in June of 2024 and have been running it in its current form since August 28, 2024. Each month we review the previous month’s positioning and performance to identify what worked and what needs improvement. A brief description of the Elev8 model and its inputs follows the review as an appendix.
February saw the model continue to grapple with changing trend dynamics. February the output was “half right,” as the model correctly rotated our allocations towards Energy, Materials and Industrials exposures. However, given new highs in January, the model maintained a cautious bull market stance rather than a defensive posture. When softer unemployment and GDP prints hit the tape early in the month, our positioning was out of step. As a result, the portfolio underperformed in February 2025 posting an excess return of -5 bps vs. our simulated S&P 500 benchmark.
Elev8 Model Indicator Dashboard & Positions (February 2025)
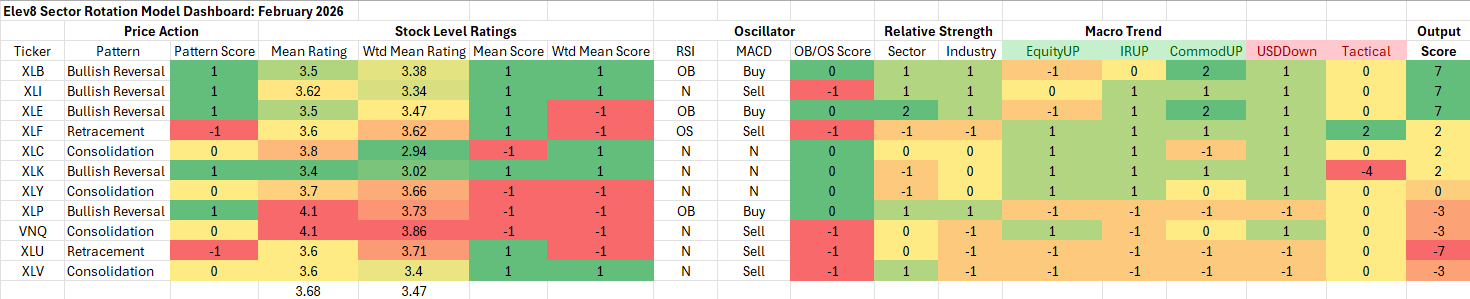
Key: Pattern = L/T (1yr+) Price Pattern of the Sector ETF, Mean Rating = simple average of 1-6 ratings (buyàsell) of all stocks within the sector, WTD Mean Rating = Cap Weighted Sector Constituent rating, OB = Overbought, OS = Oversold, N=Neutral
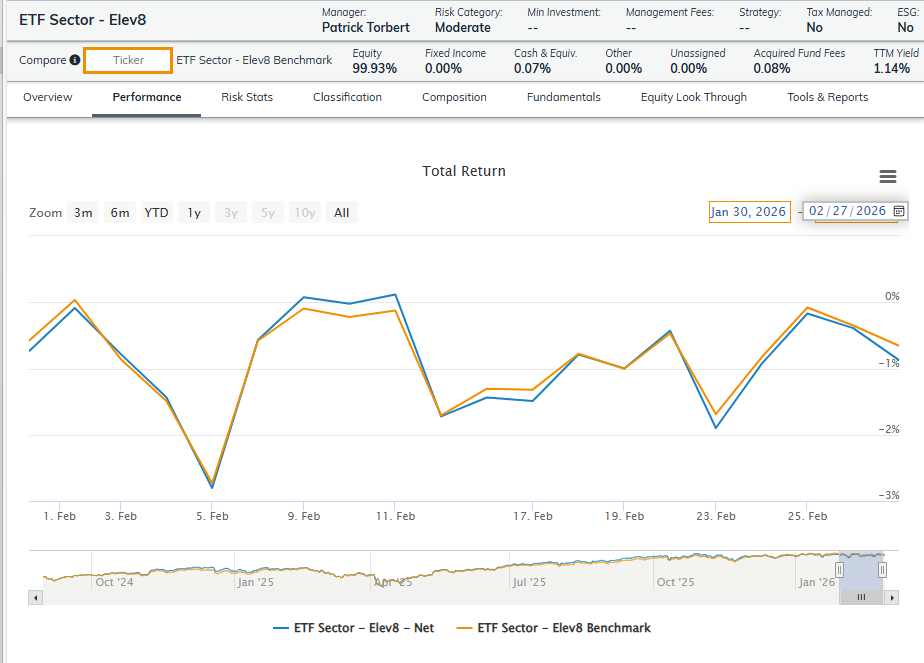
Performance Recap: Elev8 Performance vs. Benchmark (February 2026)
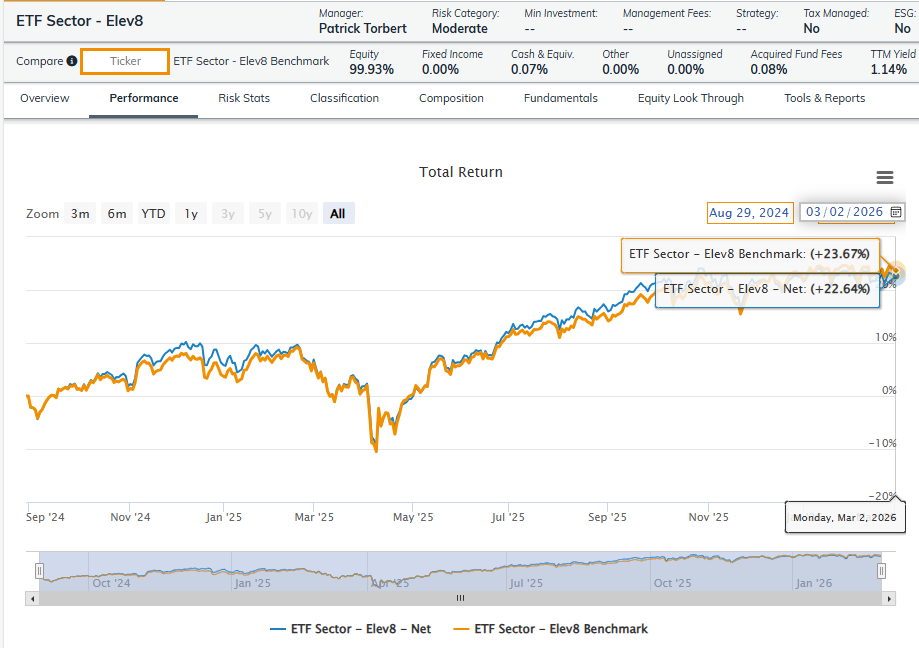
Performance Recap: Elev8 Performance vs. Benchmark (August 29, 2024 – February 28, 2026)
What worked in February
Continued upwards pressure on Commodities prices and Crude Oil, triggered Elev8 to go overweight Energy, Materials and Industrials Sectors. Those exposures outperformed the S&P 500 in February by +1050bps, +935bps and +801bps respectively and were our largest OW positions this month. We also hedged our bullish stance with a long position in the XLP Consumer Staples SPDR which outperformed SPY by +873bps in February.
What didn’t work in February
Softer economic data pulled yields lower and spurred rotation into lower vol. Sectors. Those sectors had scored the weakest in the model entering February and we were out of Utilities (+1132bps), Real Estate (+674bps) and Healthcare (+443bps) as equity investors sought haven exposures.
March Inputs & Positioning
As we enter March, the trend-following nature of the Elev8 model is clearly apparent as the model has swung to a defensive and commodities focused allocation for the coming month.
Elev8 Model Input Dashboard: March
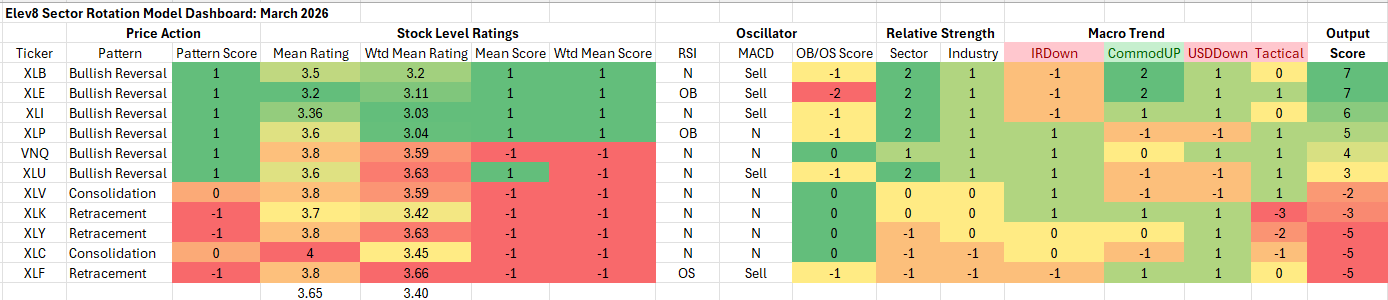
Key: Pattern = L/T (1yr+) Price Pattern of the Sector ETF, Mean Rating = simple average of 1-6 ratings (buyàsell) of all stocks within the sector, WTD Mean Rating = Cap Weighted Sector Constituent rating, OB = Overbought, OS = Oversold, N=Neutral
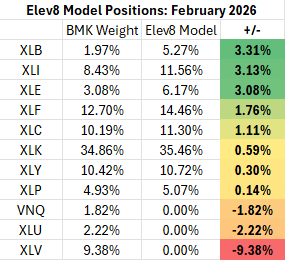
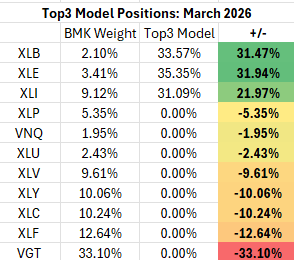
Elev8 Model Positions: March
Attribution provided by ETFAction, https://www.etfaction.com/
Other data provided by FactSet Research Systems Inc.
Appendix: What is the Elev8 Model
Elev8 Model
Elev8 is a sector rotation model that seeks to outperform the S&P 500 on a yearly basis by actively managing sector exposures relative to our simulated S&P 500 benchmark. The model seeks to generate alpha over its benchmark by allocating 100% of the portfolio to 8 of the 11 GICS Sectors comprising the S&P 500. It picks the 8 sectors that have the strongest scores in the model’s up to 14 inputs while having no exposure to 3 of the GICS Sectors that have the weakest scores in the model each month. The model can be above or below benchmark weight in the sectors it does have positions in.
Elev8 Model Inputs
- Stock Level Technical Characteristics
- Macro-overlays:
- equity trend (S&P 500)
- interest rate trend (10yr US Treasury Yield)
- commodities trend (Bloomberg Commodities Index)
- USD trend (vs. EUR & Broad Currency Indices)
- Relative performance vs. the benchmark S&P 500 at the sector and industry level
- Overbought/Oversold oscillator studies
- Tactical Overlays Include: Seasonality, Fiscal & Monetary Policy Interventions, VIX levels, Economic and Earnings alerts and considerations for exogenous events that are seen to be market moving.
