July 7, 2025
We introduced our Elev8 model in June of 2024 and have been running it in its current form since August 28, 2024. Each month we review the previous month’s positioning and performance to identify what worked and what needs improvement. A brief description of the Elev8 model and its inputs follows the review as an appendix.
Elev8 Model Indicator Dashboard & Positions (June 2025)
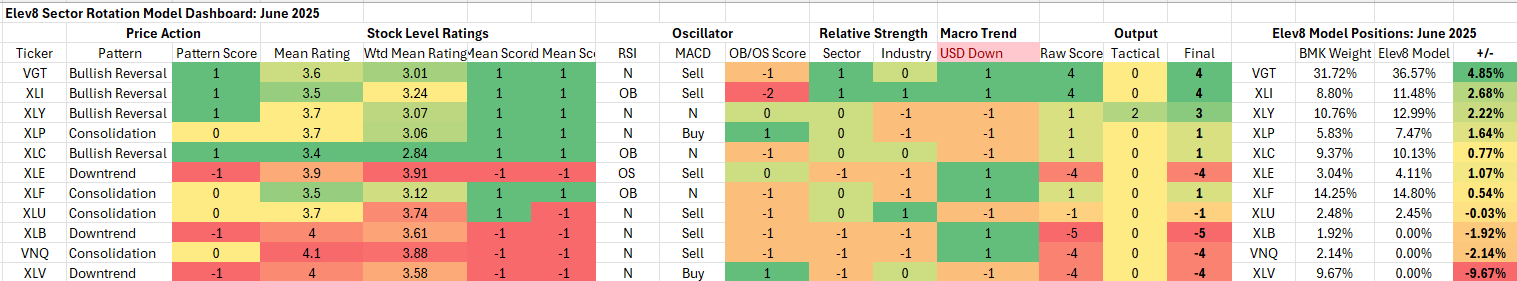
Key: Pattern = L/T (1yr+) Price Pattern of the Sector ETF, Mean Rating = simple average of 1-6 ratings (buyàsell) of all stocks within the sector, WTD Mean Rating = Cap Weighted Sector Constituent rating, OB = Overbought, OS = Oversold, N=Neutral
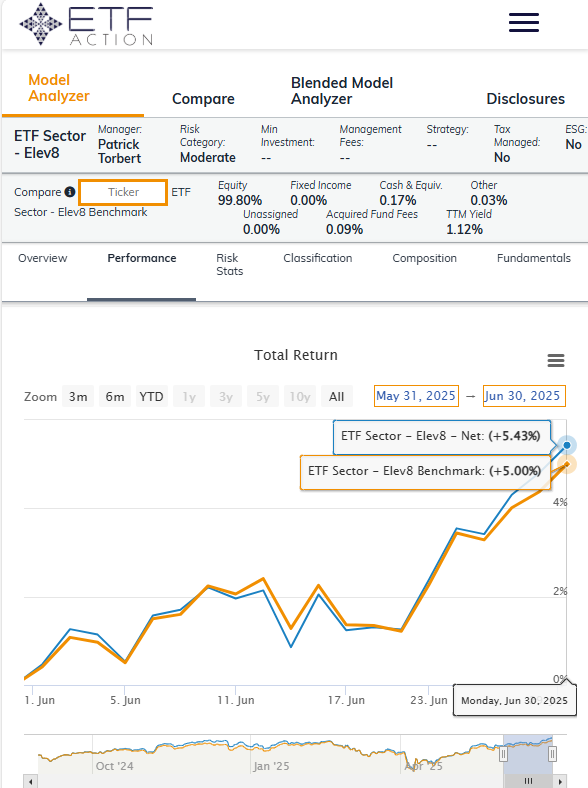
Performance Recap: Elev8 Performance vs. Benchmark (June 2025)
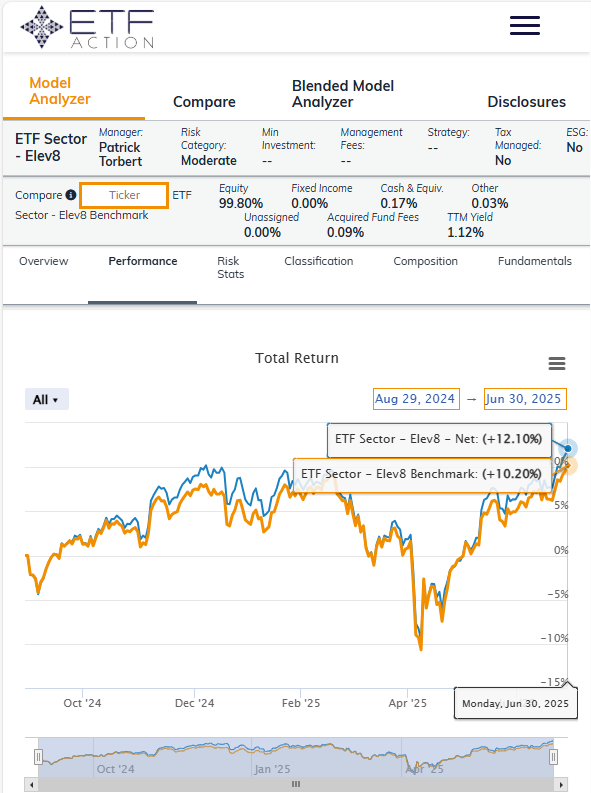
Performance Recap: Elev8 Performance vs. Benchmark (Sept. 1, 2024 – June 30, 2025)
What Worked in June
Per the handy model analyzer from our friends at ETFAction, we added 43bps above the benchmark return in June, bringing our total to +190bps since September 2024.
Our biggest long active weight in June was an overweight position of 4.85% in VGT. The model had conviction in The Technology Sector due to broad participation in the equity bullish reversal, outperformance at the industry level within the sector and a bullish profile in our quantitative overlay. The sector was the top performer for the month outperforming the S&P 500 by 4.2%
Our overweight position in XLC also outperformed by 2.1% in June and our Underweight positions in the model were in XLRE (-4.18% vs. S&P 500), XLB (-2.73% vs. S&P 500) and XLV (-2.84% vs. S&P 500) which contributed to outperformance.
What didn’t work in June
Our biggest mistake in June was in the selection of our defensive hedges. We put a long position in Staples (XLP, OW +1.64%) on as thought there was potential for downside retracement after April and May gains. That was the wrong call as Staples led all sectors to the downside, lagging by -6.34%. Investors bottom-fished Real Estate and Healthcare names to a certain extent, but steadily sold Staples and Utilities (we were EW Utilities, -0.03%).
We also got clipped by the narrowness of outperformance in June. Only 2 out of 11 sectors outperformed, Technology and Comm. Services. While we were long both, we were also long Financials (-1.41% vs. S&P 500), Discretionary (-3.97% vs. S&P 500) and Industrial (-1.41% vs. SPX) sectors as those also historically outperform in reflating and uptrending equity markets. That didn’t work out for us this month.
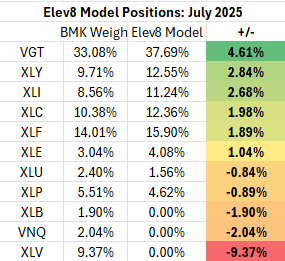
July Positioning
We further lightened up on defensive exposure in July as our read of the financial markets leads us to expect a continued bullish advance. We again are positioned long across sectors that historically outperform when equity prices move higher.
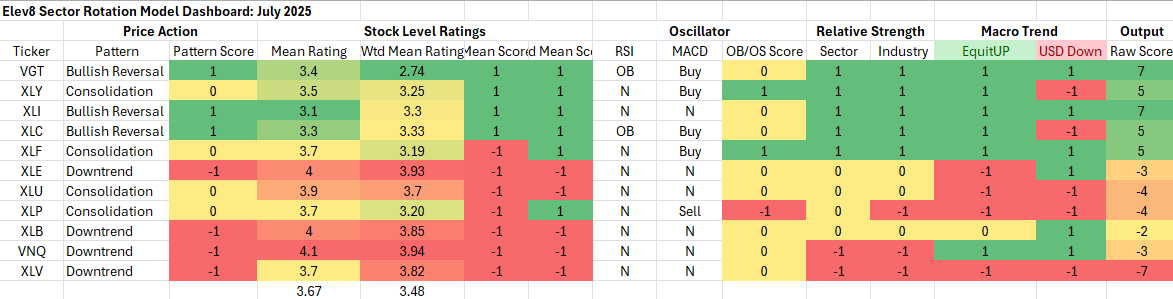
Key: Pattern = L/T (1yr+) Price Pattern of the Sector ETF, Mean Rating = simple average of 1-6 ratings (buyàsell) of all stocks within the sector, WTD Mean Rating = Cap Weighted Sector Constituent rating, OB = Overbought, OS = Oversold, N=Neutral
Attribution provided by ETFAction, https://www.etfaction.com/
Appendix: What is the Elev8 Model
Elev8 Model
Elev8 is a sector rotation model that seeks to outperform the S&P 500 on a yearly basis by actively managing sector exposures relative to our simulated S&P 500 benchmark. The model seeks to generate alpha over its benchmark by allocating 100% of the portfolio to 8 of the 11 GICS Sectors comprising the S&P 500. It picks the 8 sectors that have the strongest scores in the model’s up to 14 inputs while having no exposure to 3 of the GICS Sectors that have the weakest scores in the model each month. The model can be above or below benchmark weight in the sectors it does have positions in.
Elev8 Model Inputs
- Stock Level Technical Characteristics
- Macro-overlays:
- equity trend (S&P 500)
- interest rate trend (10yr US Treasury Yield)
- commodities trend (Bloomberg Commodities Index)
- USD trend (vs. EUR & Broad Currency Indices)
- Relative performance vs. the benchmark S&P 500 at the sector and industry level
- Overbought/Oversold oscillator studies
