
June 6, 2025
We introduced our Elev8 model in June of 2024 and have been running it in its current form since August 28, 2024. Each month we review the previous month’s positioning and performance to identify what worked and what needs improvement. A brief description of the Elev8 model and its inputs follows the review as an appendix.
Elev8 Model Indicator Dashboard & Positions (May 2025)
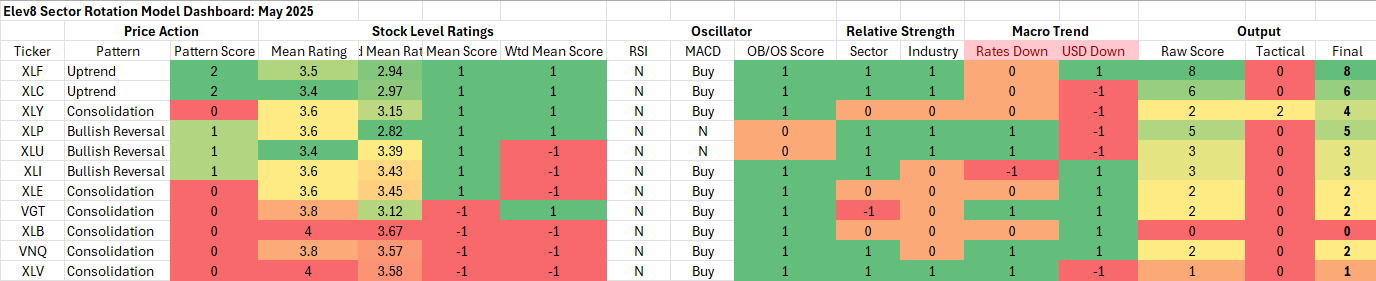
Key: Pattern = L/T (1yr+) Price Pattern of the Sector ETF, Mean Rating = simple average of 1-6 ratings (buyàsell) of all stocks within the sector, WTD Mean Rating = Cap Weighted Sector Constituent rating, OB = Overbought, OS = Oversold, N=Neutral
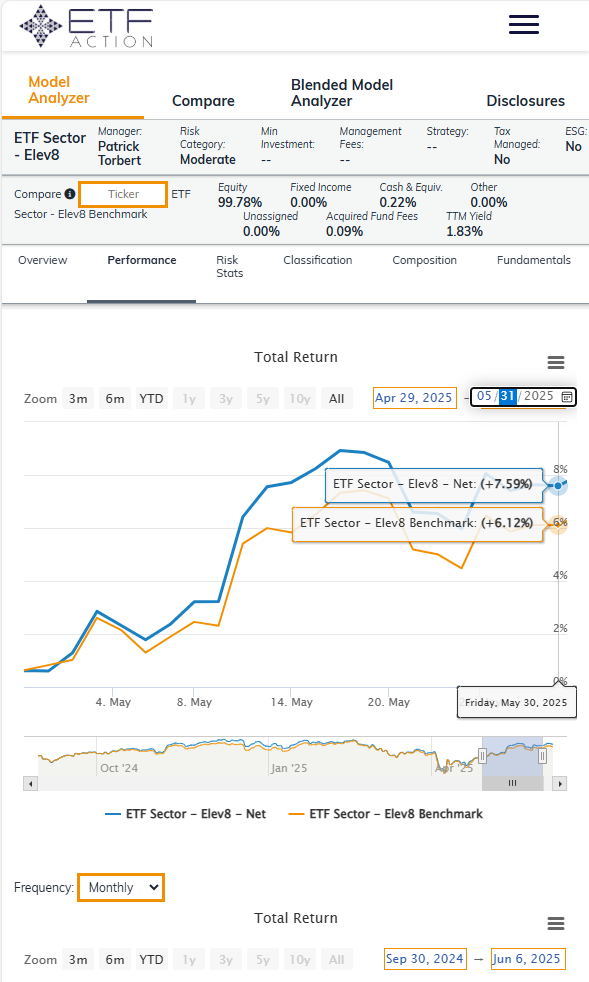
Performance Recap: Elev8 Performance vs. Benchmark (May 2025)
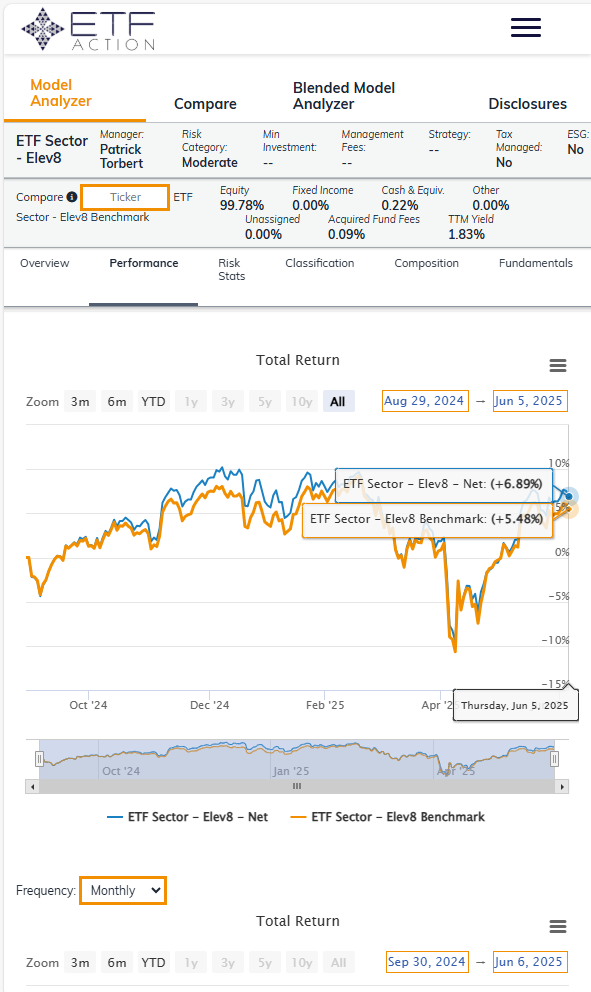
Performance Recap: Elev8 Performance vs. Benchmark (Sept. 1, 2024 – April 30, 2025)
What Worked in May
The model had a slight underweight to the Tech Sector, but the VGT ETF has a higher beta profile than the XLK as it is benchmarked to the Russell 1000 Technology Sector rather than the S&P 500 Technology Sector. That worked to the Elev8 portfolio’s advantage in May as our VGT position added alpha despite being a few bps underweight due to our cash portfolio constraints.
Our overweight positions in XLI (+1.38%) and XLY (+2.5%) gave us a boost on the long side. On the short side of the portfolio, we were out of both the Healthcare and Real Estate sectors. The -11% weight in the former was by far our biggest contributor to success in May as the Healthcare sector underperformed by almost 8%.
Our low vol. sector selection was solid overall as the model preferred Utilities (-86 bps excess returns for May) and Staples (-320 bps) over Real Estate (-449 bps) and Healthcare (-798 bps).
What didn’t work in May
We had the fortune in May that our mistakes were generally small ones. Our overweight in financial stocks underperformed (-90 bps) as risk-on rotation out of insurance stocks was a headwind. Our Energy Sector overweight was a flop as the sector underperformed by 435 bps, however the model had a low positive score, so we were only in at 84 bps above the benchmark position.
Our +2.97% overweight in the XLC was a wash (+20 bps).
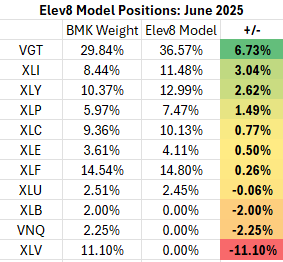
June Positioning
Key: Pattern = L/T (1yr+) Price Pattern of the Sector ETF, Mean Rating = simple average of 1-6 ratings (buy/sell) of all stocks within the sector, WTD Mean Rating = Cap Weighted Sector Constituent rating, OB = Overbought, OS = Oversold, N=Neutral
Appendix: What is the Elev8 Model
Elev8 Model
Elev8 is a sector rotation model that seeks to outperform the S&P 500 on a yearly basis by actively managing sector exposures relative to our simulated S&P 500 benchmark. The model seeks to generate alpha over its benchmark by allocating 100% of the portfolio to 8 of the 11 GICS Sectors comprising the S&P 500. It picks the 8 sectors that have the strongest scores in the model’s up to 14 inputs while having no exposure to 3 of the GICS Sectors that have the weakest scores in the model each month. The model can be above or below benchmark weight in the sectors it does have positions in.
Elev8 Model Inputs
- Stock Level Technical Characteristics
- Macro-overlays:
- equity trend (S&P 500)
- interest rate trend (10yr US Treasury Yield)
- commodities trend (Bloomberg Commodities Index)
- USD trend (vs. EUR & Broad Currency Indices)
- Relative performance vs. the benchmark S&P 500 at the sector and industry level
- Overbought/Oversold oscillator studies
