April 3, 2025
We introduced our Elev8 model in June of 2024 and have been running it in its current form since August 28, 2024. With 7-months of track record behind our method, we wanted to review performance and share some lessons learned from our 7 months running the strategy. Our friends over at ETFAction.com have provided us with a robust set of ETF research and performance attribution tools to help us analyze our models and their software powers our portfolio analysis and attribution capability.
But first, we go through a brief review of what the Elev8 model is and how it selects positions. Please feel free to skip the top section if you are already familiar with our approach.
What is the Elev8 Model
Elev8 is a sector rotation model that seeks to outperform the S&P 500 on a yearly basis by actively managing sector exposures relative to our simulated S&P 500 benchmark. The model seeks to generate alpha over its benchmark by allocating 100% of the portfolio to 8 of the 11 GICS Sectors comprising the S&P 500. It picks the 8 sectors that have the strongest scores in the model’s up to 14 inputs while having no exposure to 3 of the GICS Sectors that have the weakest scores in the model each month. The model can be above or below benchmark weight in the sectors it does have positions in.
Elev8 Model Inputs
- Stock Level Technical Characteristics
- Macro-overlays:
- equity trend (S&P 500)
- interest rate trend (10yr US Treasury Yield)
- commodities trend (Bloomberg Commodities Index)
- USD trend (vs. EUR & Broad Currency Indices)
- Relative performance vs. the benchmark S&P 500 at the sector and industry level
- Overbought/Oversold oscillator studies
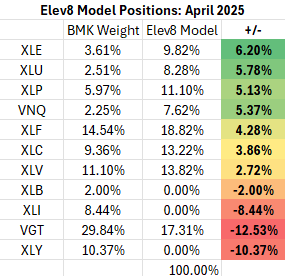
Elev8 Model Indicator Dashboard & Positions (April 2025)

Key: Pattern = L/T (1yr+) Price Pattern of the Sector ETF, Mean Rating = simple average of 1-6 ratings (buyàsell) of all stocks within the sector, WTD Mean Rating = Cap Weighted Sector Constituent rating, OB = Overbought, OS = Oversold, N=Neutral
Performance Recap: Elev8 Performance vs. Benchmark (Sept. 1, 2024 – March 31, 2025)
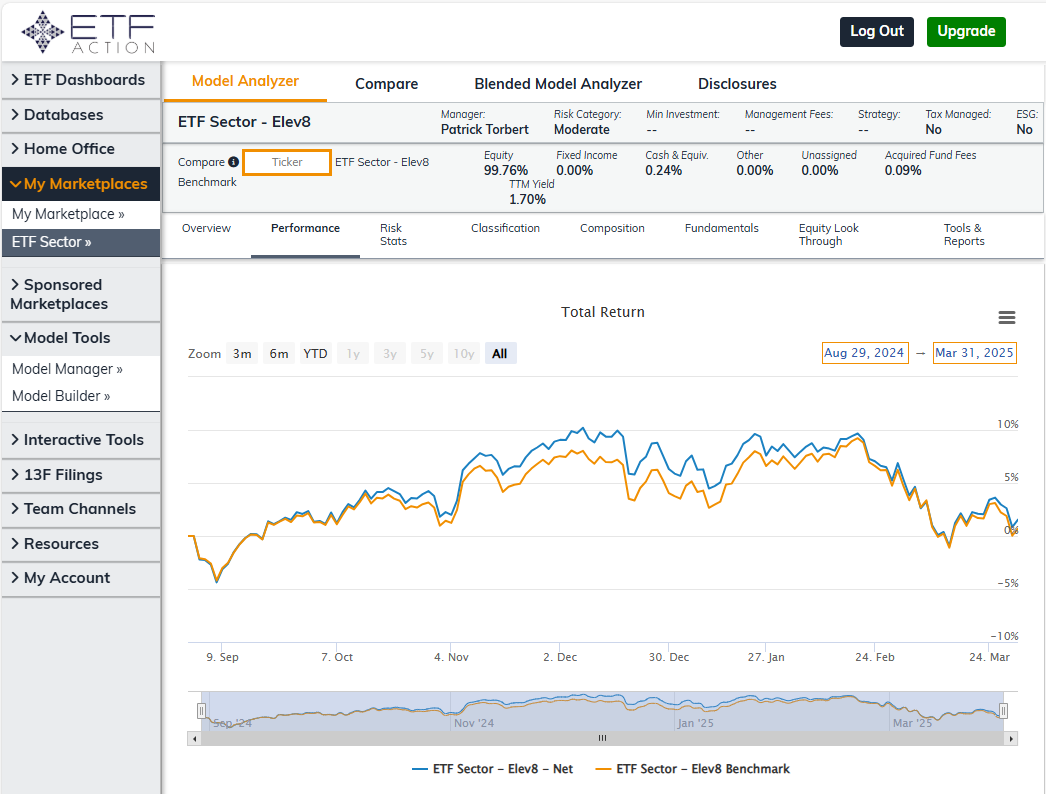
Below is the holdings history for the Elev8 Portfolio vs. the Elev8 Benchmark which is a simulated version of the S&P 500 using Select Sector SPDR ETFs as sector proxies weighted correspondingly to S&P 500 GICS Sector weights. The benchmark is rebalanced quarterly on the same day as the S&P 500 Index itself. Elev8 outperformance peaked on December 16th as the model had returned 9.95% since inception on that date vs. the benchmark return of 7.2%. We had some false signals from the model in January which will detail below, but needless to say, the model had trouble as equities rolled over into correction and found its footing as it adjusted to the emergent downtrend. Currently the Elev8 model is up 1.56% from inception through the end of March while the S&P 500 is up 0.7% over that time period.
Holdings History

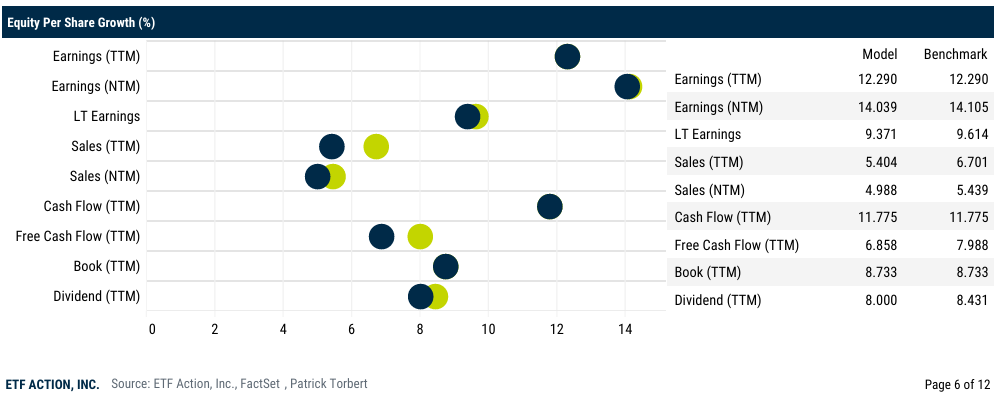
Fundamental Comparison: Elev8 Model Portfolio vs. Benchmark

What worked: 2024, trend following in a trending market
Trend-following models do well when conditions are relatively stable over a longer-term timeframe. We conceive of timeframes as short-term (< 3 months), intermediate-term (3-9 months) and longer-term (> 9 months). Trend-following strategies are most likely to add alpha when macro trends are stable for time periods 6-months or longer. When considering the Elev8 model’s performance history above, we can see that the model steadily added alpha above the benchmark return from September through early January of 2025 as the S&P 500 traded in an upwards trending price structure.
The model added alpha through being long sectors that historically outperform when equities are in a bull trend (one of our macro inputs). The bull market trend supported higher momentum stocks which is a sweet spot for our stock selection process as our securities level buy signal is based on a combination of inputs that favor positive 3–6-month momentum.
The model was positive for March as it was positioned for modest downside after equities rolled over to the downside in February. March turned out to be a down month, but oversold conditions at mid-month precipitated a bounce higher and the model positioning benefitted.
As trend has shifted from bullish to bearish for US equities due to the emergence of the Trump Administrations Tariff/Trade War policies the model has entered April on a defensive footing which is looking appropriate based on MTD developments.
What didn’t work: January 2025, over trading macro signals
The Elev8 model generates signal from a combination of bottoms-up (stock level) and top-down (macro level) inputs. The core signals in the model are derived from the stocks within the ETFs we buy as various forms of market internal data. Tactical signals are derived from macro trends that either support or undercut the favorability of the stock level signals.
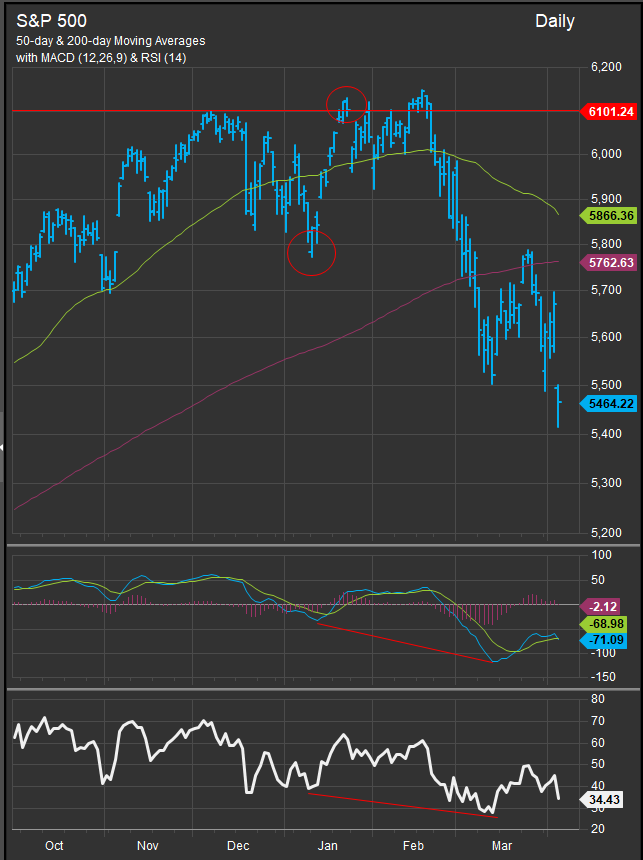
Our macro signals got us into some trouble in January and had the Elev8 model wrong-footed for February. We had a false upside break-out in interest rates above a major resistance level on January 12th (chart below). We decided to make a tactical trade off of that signal given the potential for inflationary risks to negatively affect the Growth trade.
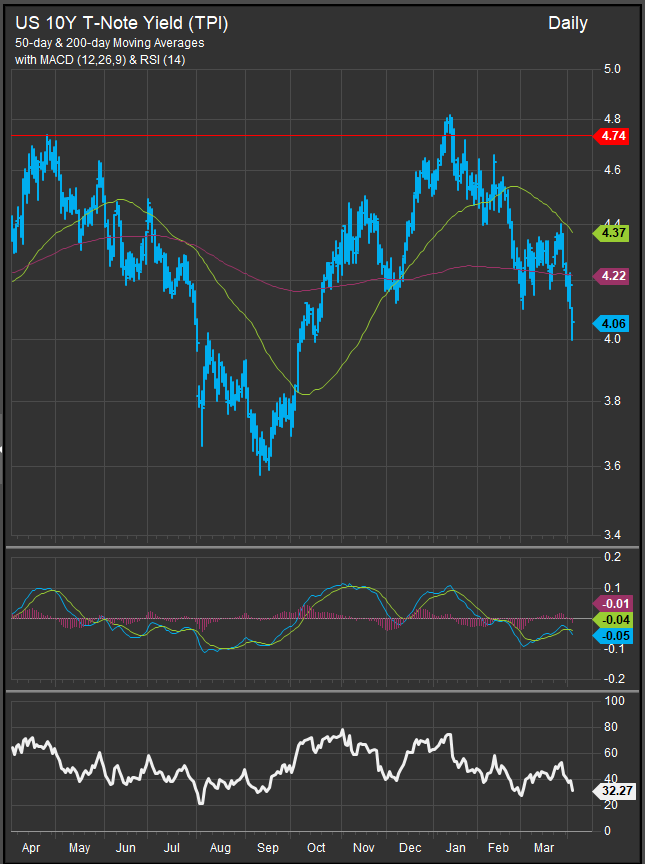
After we reduced risk and upside equity exposure due to our bearish rate signal you can observe the forward price action on the S&P 500. After our signal on the 12th, we entered January 13, positioned for more near-term downside. To put it bluntly, we stepped on a rake. We then compounded the mistake by making a similarly aggressive trade 11 days later on January 24 when the S&P 500 broke-out to the upside above the December 2024 high (Chart below). We put on more risk after that signal. We stayed short Info Tech., but we were long Financials and Discretionary stocks when they underperformed in February and short most of the lower vol. sectors as a result of that allocation decision.
How We’re Thinking About Solutions
After running our trend-following model for 7-months we’ve made one change to our approach. We aren’t executing tactical intra-month trades anymore as part of the strategy. This conclusion was arrived at for two reasons. Macro signals that we use are heavily influenced by large levels of algorithmic trading in the futures markets. That’s typically fast money that is in and out trying to make a trading profit and doesn’t necessarily represent a price discovery motive. There’s actually a motive there to dislocate the market and create volatility by pushing the price or yield past key trading levels.
We are also working on a complimentary mean-reversion strategy to compliment our core trend following approach. Our stock level signals are generally accurate, but they move slowly when transitioning from bull to bear. This is an off shoot of behavior. Market tops typically form over longer periods of time because the enthusiasm generated by the bull trend typically creates a dynamic where informed sellers are handing off stocks to late arriving entrants in the bull market as they exit. Eventually new entrants dry up and the price must fall. Typically, that’s a 6-12 month process. Look at market tops in 2000 and 2008 for examples. We need a solution for this as our model process will likely give us at least one month of really bad positioning advice on a bull-to-bear transition while the directional trend of the market is in doubt.
Our current project is researching indicators that can give us a contrarian signal for risk-off and risk on. Being contrarian is important because we need an approach that has the potential to warn us when things are still going relatively well for stocks. We want to tie that signal to an inverse reading on our stock level methodology so we have the capability to buy into lagging stocks as early into a potential rotation as we can without compromising the core alpha proposition of our trend-following model. At a high level this signal likely will involve low readings on the VIX, overbought conditions among riskier assets and wide spreads between Growth and Value factors.

