
Equities closed Monday mixed with the Dow lagging off 0.36% while the S&P 500 finished flat and the Nasdaq Composite added 0.21%. Technology Sector shares continued to move higher in the near-term retracing steep declines from the beginning of the month, while the Energy sector was also a leader on the back of a >4% move higher in Crude.
Commodities prices were also higher with the Bloomberg Commodities Index adding >1% on the day while the Yield on the 10yr Treasury firmed slightly to 3.907%. Small and Mid-Cap. stocks were down on the day while MSCI EAFE and EM Indices were up 0.88% and 1.64% respectively.
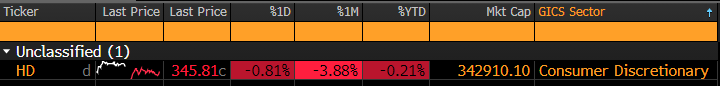
PPI surveys are out ahead of Wednesday’s potentially pivotal CPI release. The Earnings calendar remains subdued with HD the lone report before the bell on Tuesday.
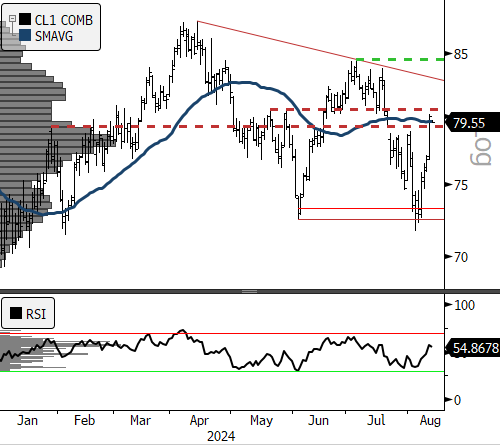
Positioning Alert: Crude price at horizontal resistance
We had highlighted Commodity price weakness in our weekly market letter as a reason to favor min vol. sectors. Now we will see if there is more upside follow through with price at horizontal resistance on the WTI Crude price chart. Our bullish reversal signal for Crude is triggered at the $84.54 level. See the chart below. Price action becomes more constructive above the 80 level.
Eco Data Releases | Tuesday August 13th, 2024
| Date Time | Event | Survey | Actual | Prior | Revised | |
| 08/13/2024 06:00 | NFIB Small Business Optimism | Jul | 91.5 | — | 91.5 | — |
| 08/13/2024 08:30 | PPI Final Demand MoM | Jul | 0.20% | — | 0.20% | — |
| 08/13/2024 08:30 | PPI Ex Food and Energy MoM | Jul | 0.20% | — | 0.40% | — |
| 08/13/2024 08:30 | PPI Ex Food, Energy, Trade MoM | Jul | 0.20% | — | 0.00% | — |
| 08/13/2024 08:30 | PPI Final Demand YoY | Jul | 2.30% | — | 2.60% | — |
| 08/13/2024 08:30 | PPI Ex Food and Energy YoY | Jul | 2.60% | — | 3.00% | — |
| 08/13/2024 08:30 | PPI Ex Food, Energy, Trade YoY | Jul | — | — | 3.10% | — |
S&P 500 Constituent Earnings Announcements by GICS Sector | Tuesday August 13th, 2024
HD Looks like a Big Top
Home Depot is oversold heading into earnings, though positive reports have not always matched up with positive results for the stock as the 3yr, weekly chart below shows.
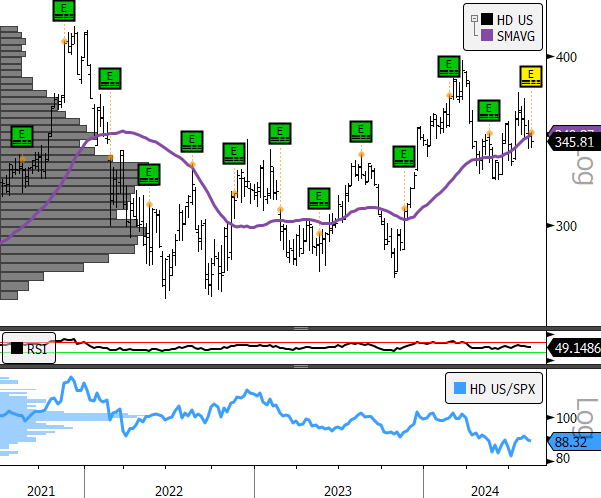
- HD 3yr, weekly price (200-day moving average | RSI |Relative to S&P 500 )
The deep history quarterly chart shows a very heavy looking stock in a potential long-term distributional pattern. I would be fading rallies in HD going forward. The setup looks reminiscent of 2000-2002 period. See on the chart below.
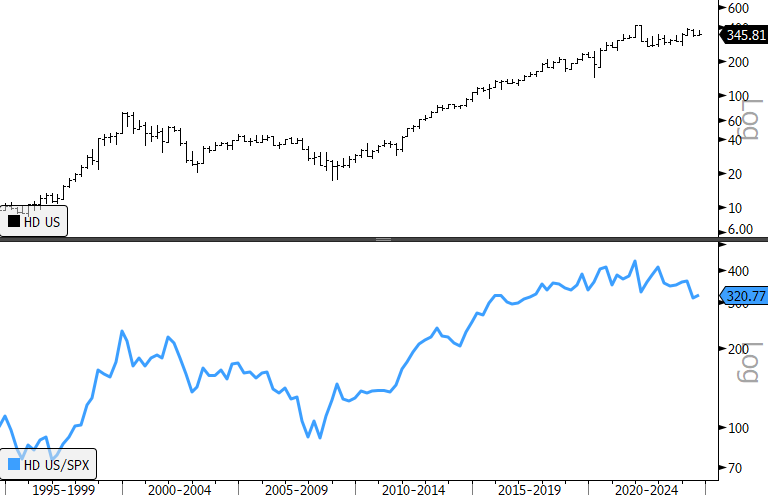
- HD 30yr, Qtrly price ( Relative to S&P 500 )
Sources: Bloomberg
