


The equity rally paused on Tuesday as the major US indices broke multi-day winning streaks. The Nasdaq led shares lower down 0.33% while the S&P 500 gave up 0.20% and the Dow was off 0.15%. At the sector level, Energy shares were the downside catalyst with XLE losing 2.64% on the day. Performance among the other sectors was generally more compressed as XLP added 0.50% as the day’s leading sector with XLU and XLRE also up on the day. The rest of the sectors posted negative results despite none being off more than 0.36%.
Futures for the MSCI EAFE and EM indices were off 0.36% and 0.84% respectively while the Russell 2000 Index fell 1.17% in the day’s trading.
The yields on the 2yr and 10yr treasury moved lower to 3.944% and 3.818% respectively. Crude prices were down 0.74% with the WTI September contract now trading at $73.82 a barrel near the low end of its intermediate-term trading range. Commodities prices broadly edged higher with the Bloomberg Commodities Index trading up 0.23% to 96.6 level, just a shade above long-term support. This is especially sluggish action for commodities prices considering the context of the longer-term bull market for stocks and the historical tailwind of a weakening dollar in the near-term as USD has weakened against major crosses in the past weeks.
FOMC meeting minutes at 2pm headline Wednesday’s economic releases while a smattering of co.’s post earnings headlined by TGT. Powell’s Jackson Hole speech and NVDA’s earnings at the end of the month are the next likely “tent pole” events for equities.
Eco Data Releases | Wednesday August 21, 2024
| Date Time | Event | Survey | Actual | Prior | Revised | |
| 08/21/2024 07:00 | MBA Mortgage Applications | 16-Aug | — | — | 16.80% | — |
| 08/21/2024 10:00 | BLS releases preliminary annual payrolls benchmark revision | |||||
| 08/21/2024 14:00 | FOMC Meeting Minutes | 31-Jul | — | — | — | — |
S&P 500 Constituent Earnings Announcements by GICS Sector | Wednesday August 21, 2024
ADI, TGT, TJX, A, NDSN, SNPS
Target Corp. is an interesting case heading into its earnings announcement. While discount retailers COST and WMT have thrived in this bull cycle, TGT has lagged. The below chart shows TGT price over a 2yr time frame. Short Interest is high in the stock and it has been a YTD laggard in a strong category. There is potential for an upside surprise here given elevated pessimism.
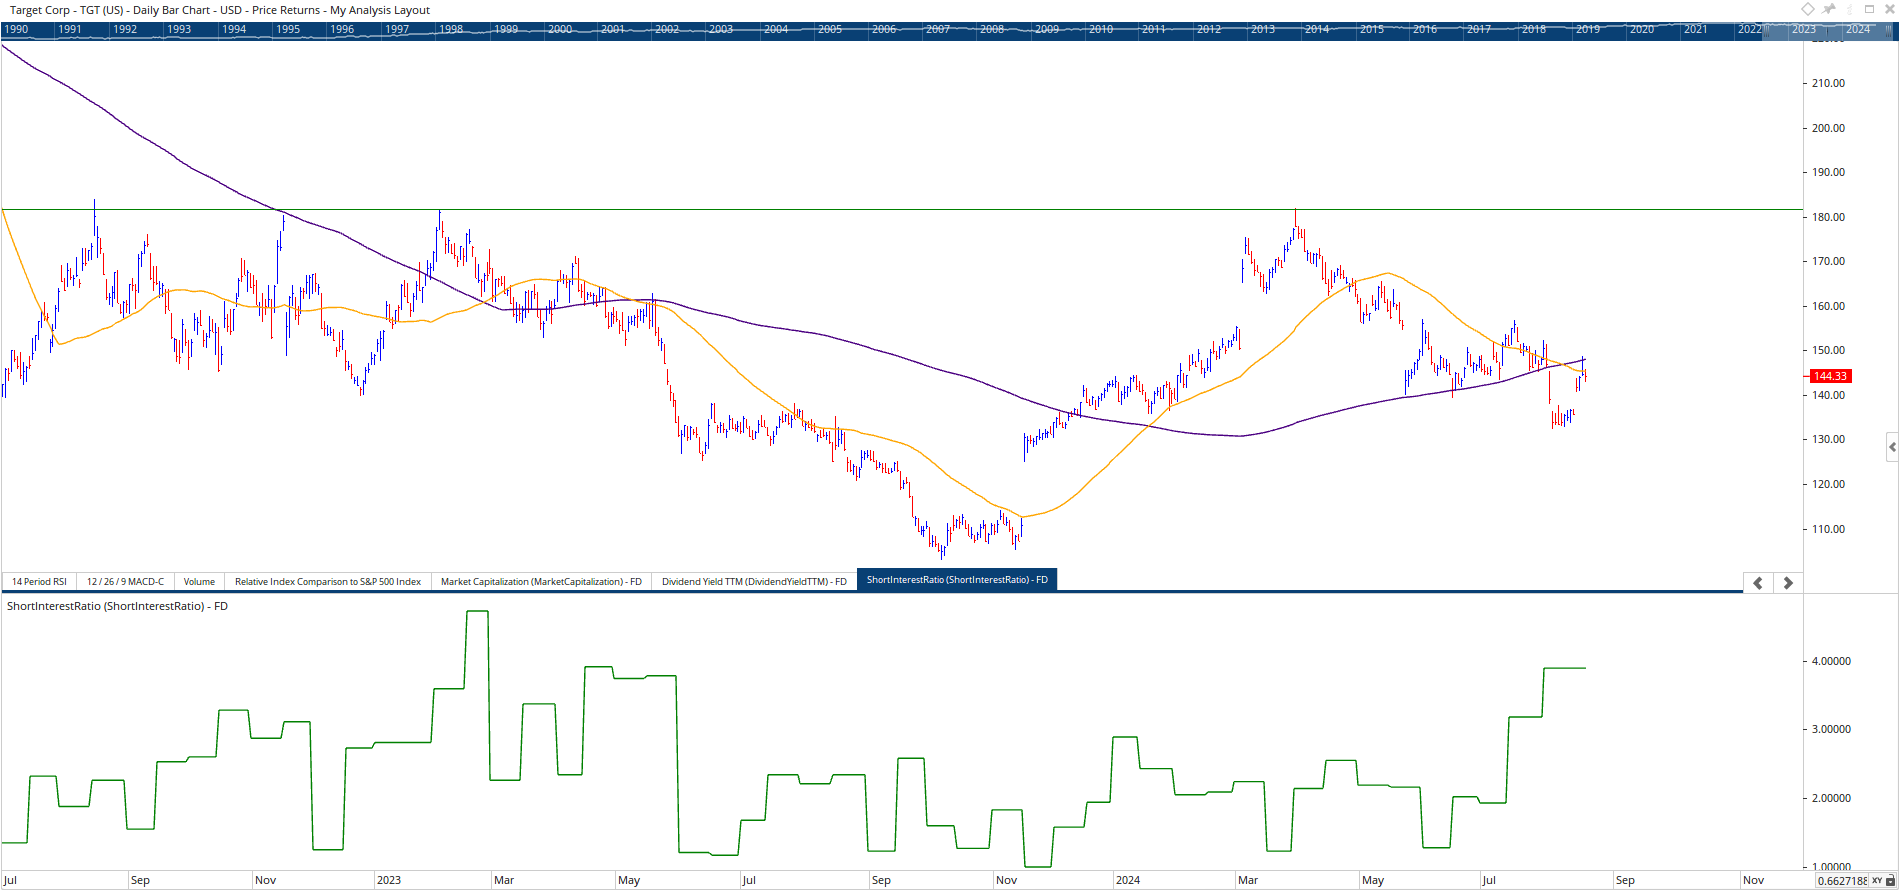
- TGT 2yr, daily (200-day m.a. | 50-day m.a.)
- Panel 2: Short Interest (% of open interest that is in put options): A higher level corresponds to an elevated number of speculators taking negative bets on the stock. Any postive surprise in a stock witht his setup is often powerful as shorts are forced to cover their positions by buying stock on unlooked for good news.
Data sourced from Optuma, Yahoo Finance
