
Equities were routed again on Monday after a tough end to the previous week. The S&P 500 Index suffered its steepest 1-day decline since 2022, losing 3.00% on the day. The Dow was off 2.60% and the Nasdaq lagged, posting a decline of 3.43%. Sunday saw Goldman Sachs economists raise their recession probability call to 25% from 15% while the unemployment rate jumped from 3.7% to 4.3%, the highest level since October 2021.
International equities sold off in sympathy with the US, and in their inimitable style managed to do even worse than their domestic counterparts. The Nikkei 225 index was down >12% on the day.
2yr Treasury Yields rose to 3.92% while the 10yr Yield continued its recent decline settling at 3.788%. The DXY Index was sharply lower on the day, but still above long-term support on the chart. The VIX, which measures volatility priced into the options market, had spiked to an intra-day high of 66 before settling at 38.57. Animal spirits have hit the tape.
Commodities prices broke through important support as measured by the Bloomberg Commodities index which dropped to 93.90 by the close.
A light economic calendar for Tuesday along with a heavy dose of earnings. UBER, CAT and SMCI highlight about 3 dozen releases.
Best that can be said about the day, equities finished off worst levels, and the evening futures session is showing a mild positive uptick as of this writing.
Eco Data Releases | Tuesday August 6th, 2024
| Date Time | Event | Survey | Actual | Prior | Revised | |
| 08/06/2024 08:30 | Trade Balance | Jun | -$72.5b | — | -$75.1b | — |
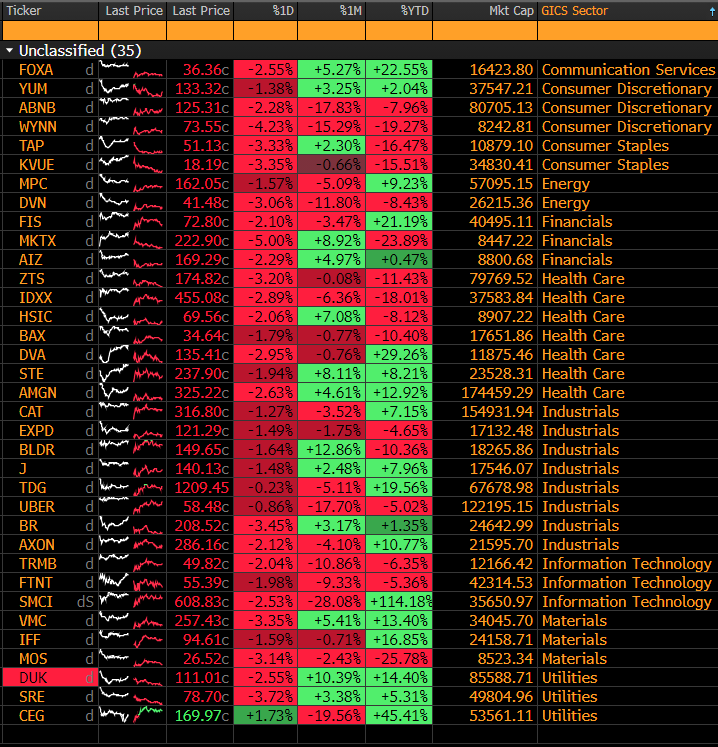
S&P 500 Constituent Earnings Announcements by GICS Sector | Tuesday August 6th, 2024
Tactical Tuesday
It’s been a tough couple of weeks for XLK and Tech shares in general. AI optimism has become a double-edged sword as investors take profits and head for the exits now that the economic data has turned softer. Peak to trough, the decline is at 19.9%, just short of a bear market for the large cap. technology sector. When is the right time to speculate for the other direction? We get excited about “wash-out” level internals. When almost every stock in a sector is below its 50-day moving average despite a long-term uptrend, we are usually getting close to a buyable low for the Sector. Here’s a look at the XLK internals presently.
We associate legitimate wash outs with <20% of constituents above their 50-day moving average. As we can see from the chart below, the current reading is 31.34%. We’ve got some more pain to go before the Bear walks away from the carcass based on this gage.

- Panel 1: XLK
- Panel 2: % of Constituents Above 50-day moving average
- Panel 3: % of Constituents Above 200-day moving average
- Panel 4: New 52-wk Highs
- Panel 5: New 52-wk Lows
Sources: Bloomberg
