
Equities started the new week in the positive with the Dow posting a gain of 0.53% to pace the Large Cap. benchmarks. The Nasdaq added 0.40% while the S&P 500 moved up 0.28%. At the sector level Energy and Financials each gained more than 1.4% while Utilities sector shares were off 2.43%, followed by the Staples sector down 0.58%.
We had written in our weekly note about potentially selling our XLC long, but buyers have stepped in above near-term support. We will keep our powder dry for now.
Overall, the tape had a bullish tint to it, with 275 S&P 500 stocks advancing to 225 declining and cyclicals leading at the stock and sector level. Small Cap. stocks continued their near-term rally with the Russell 2000 gaining 1.80%.
Yields on the 2yr and 10yr Treasuries softened slightly. Commodities prices were down 1.14% and Crude finished the day at $81.80.
The economic calendar is busy for Tuesday with Retail Sales, and Import/Export prices headlining the releases. Also, a host of large cap. financials report before the bell, looking to add to the near-term momentum of Bank earnings last week.
Eco Data Releases | Tuesday July 16th, 2024
| Date Time | Event | Survey | Actual | Prior | Revised | |
| 07/16/2024 08:30 | New York Fed Services Business Activity | Jul | — | — | -4.7 | — |
| 07/16/2024 08:30 | Retail Sales Advance MoM | Jun | -0.30% | — | 0.10% | — |
| 07/16/2024 08:30 | Retail Sales Ex Auto MoM | Jun | 0.10% | — | -0.10% | — |
| 07/16/2024 08:30 | Retail Sales Ex Auto and Gas | Jun | 0.20% | — | 0.10% | — |
| 07/16/2024 08:30 | Retail Sales Control Group | Jun | 0.20% | — | 0.40% | — |
| 07/16/2024 08:30 | Import Price Index MoM | Jun | -0.20% | — | -0.40% | — |
| 07/16/2024 08:30 | Import Price Index ex Petroleum MoM | Jun | -0.20% | — | -0.30% | — |
| 07/16/2024 08:30 | Import Price Index YoY | Jun | 1.00% | — | 1.10% | — |
| 07/16/2024 08:30 | Export Price Index MoM | Jun | -0.10% | — | -0.60% | — |
| 07/16/2024 08:30 | Export Price Index YoY | Jun | 1.00% | — | 0.60% | — |
| 07/16/2024 10:00 | Business Inventories | May | 0.50% | — | 0.30% | — |
| 07/16/2024 10:00 | NAHB Housing Market Index | Jul | 43 | — | 43 | — |
S&P 500 Constituent Earnings Announcements by GICS Sector | Tuesday July 16th, 2024
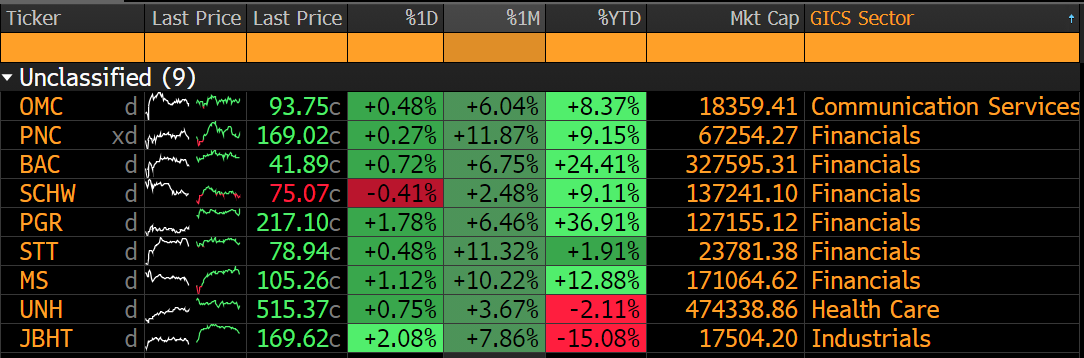
MS and BAC among others look to keep a strong rally going for the Financial Sector after Goldman’s earnings were well received by the street. UNH also reports, and an upside break-out there would be material to the chart. However, UNH and the XLV have score low in our work. More interesting to us is the nascent strength in Financials and Consumer Discretionary. These sectors are showing signs of material bullish reversal which would be a bullish “tell” for the market as a whole. Below is the chart of Morgan Stanley, trading into resistance at $105. A move higher would constitute a multi-year “base” break-out with a long-term upside target of $145.
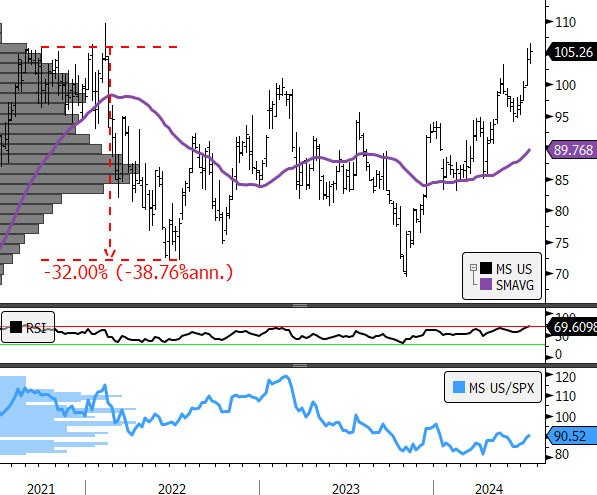
- Morgan Stanley 3yr, weekly (200-day m.a.)
- RSI
- Relative to S&P 500
Tactical Tuesday: Keep an eye on XLI
Over the past two weeks we’ve seen the Discretionary and Financial Sectors improve performance and show bullish reversals on the chart. From a macro perspective, these sectors have been aided by falling interest rates, falling commodities and input prices in combination with a resilient consumer. If these trends continue, the Industrials Sector could be close to the front of the line for a turn. Performance has declined sharply since the end of April, but in absolute terms the XLI is consolidating and has recently bounced off support. There is potential for a “catch-up” trade here if investors capitulate to a bullish outlook as interest rates decline.
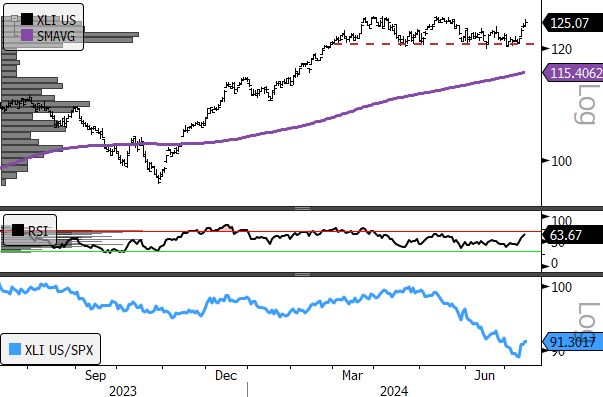
- XLI, 1yr, daily (200-day m.a.)
- Panel2: RSI—Going overbought here would be a GOOD thing
- Panel 3: Relative to S&P 500—At multi-year lows
Sources: Bloomberg
