Equities closed mixed on Friday with the Nasdaq printing a 4th record high for the week up 0.12%. The S&P 500 was off 0.04% while the Dow gave back 0.23% to close out the week. CAT and BA dragged down the Dow while cruise lines were the worst performers in the S&P 500.
Futures for Monday are off best levels with the Nasdaq expected to open up 0.16% while the S&P 500 (-0.04%) and Dow (-0.12%) are expected to open lower. Empire Manufacturing is the lone economic release today while Lennar reports its quarter after the bell with housing stocks at a potential pivot.
On Wall Street, Goldman upped its S&P 500 price target to 6300, while Citi downgraded European stocks on concerns of political turmoil.
At ETFsector.com, our chief concern is the narrowness of the equity markets outperforming cohort which is very concentrated in the Tech. Sector. We are looking for improvement outside of that group to give us confidence that the bull market expansion can continue.
Eco Data Releases | Monday June 17th, 2024
| Date Time | Event | Survey | Actual | Prior | Revised | |
| 06/17/2024 08:30 | Empire Manufacturing | Jun | -11.3 | — | -15.6 | — |
S&P 500 Constituent Earnings Announcements by GICS Sector | Monday June 17th, 2024

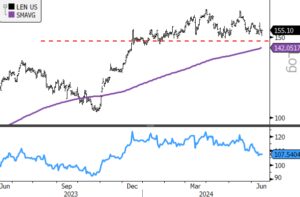
LEN reports with price looking distributional over the intermediate-term. $146 is a key support level on the chart and a weak quarter that pushes it below would trigger a technical sell signal. Lower rates in the near-term provide some reason for optimism going forward, but given the lags built into the housing market, the best buy setup may come in a few months rather than today.

- LEN (200-day m.a. | Relative to S&P 500)
- Support on the chart is at $146 and a key level to sustain the longer-term bull trend
Momentum Monday
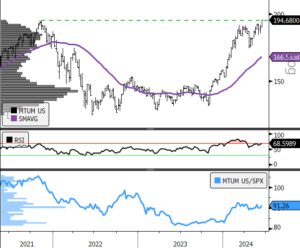
Momentum stocks broadly took a time-out from March through early May, but the iShares MSCI USA Momentum Factor ETF is showing an enticing long-term setup with a “cup & handle” pattern forming over the past 2+ years. This pattern implies +33% upside over the longer-term on a break-out above long-term resistance at $195. This theme remains leadership until proven otherwise.

- MTUM (200-day m.a. | RSI | Relative to S&P 500)
- A move above $195 would register a longer-term buy signal for MTUM
Sources: Bloomberg
