
Another strong day for equities with records for the S&P 500 (+0.77%) and the Nasdaq (+0.95%) as the Dow also added 0.49% as buyers continue to favor Growth and Momentum factors in the near-term. The 10yr yield backed up to 4.28% but remains in a downtrend under its 200-day moving average. WTI Crude has now rallied to near-term resistance with $80.50 a key level on the price chart.
Defensive sectors lagged on the day with rates rising. Healthcare, Utilities and Real Estate were down on the day as the large cap. XLY led the tape up 1.76% on the day followed by XLK adding 1.52%. XLI, XLP and XLF also outperformed the S&P 500 after a brutal 6 weeks for cyclical sectors.
Overall investors continue to ride momentum themes in 2024 as inflation hasn’t been hot enough to spur rate risk speculation.
Surveying the daily news and commentary, we continue to see more concerns among the bearish crowd that we are in a bubble. We politely disagree. Historically there is often consolidation heading into November during presidential election years, but we are in a clear bull market with well-defined leadership at present. We don’t see big headwinds from rates or commodities prices presently, but we do note that those are again rising. We’d need to see YTD highs there to get concerned.
Eco Data Releases | Tuesday June 18th, 2024
| Date Time | Event | Survey | Actual | Prior | Revised | |
| 06/18/2024 08:30 | New York Fed Services Business Activity | Jun | — | — | 3 | — |
| 06/18/2024 08:30 | Retail Sales Advance MoM | May | 0.30% | — | 0.00% | — |
| 06/18/2024 08:30 | Retail Sales Ex Auto MoM | May | 0.20% | — | 0.20% | — |
| 06/18/2024 08:30 | Retail Sales Ex Auto and Gas | May | 0.40% | — | -0.10% | — |
| 06/18/2024 08:30 | Retail Sales Control Group | May | 0.50% | — | -0.30% | — |
| 06/18/2024 09:15 | Industrial Production MoM | May | 0.30% | — | 0.00% | — |
| 06/18/2024 09:15 | Capacity Utilization | May | 78.60% | — | 78.40% | — |
| 06/18/2024 09:15 | Manufacturing (SIC) Production | May | 0.30% | — | -0.30% | — |
| 06/18/2024 10:00 | Business Inventories | Apr | 0.30% | — | -0.10% | — |
| 06/18/2024 16:00 | Total Net TIC Flows | Apr | — | — | $102.1b | — |
| 06/18/2024 16:00 | Net Long-term TIC Flows | Apr | — | — | $100.5b | — |
S&P 500 Constituent Earnings Announcements by GICS Sector | Tuesday June 18th, 2024
No S&P 500 constituents report
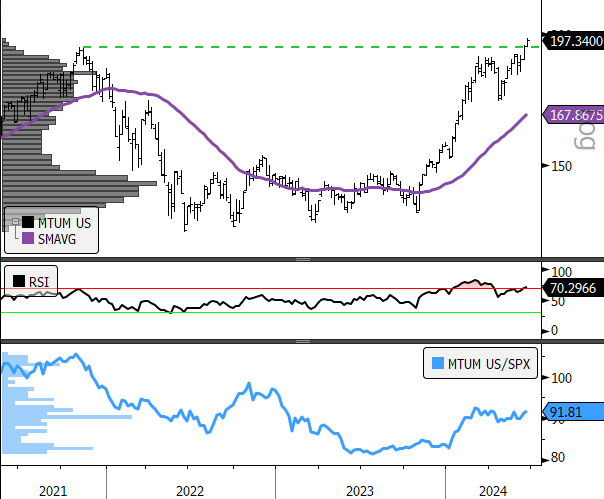
- MTUM iShares Momentum ETF (200-day m.a. | RSI | Relative to S&P 500)
- MTUM breaks out on another record day for the Nasdaq and the S&P 500
Tactical Tuesday
With Growth and Momentum in the driver’s seat, the question becomes one of monitoring the other side of the trade for signs of life. There have been none since May’s benign CPI print. XLK and XLC have been unchallenged as leadership. Commodities prices are a key tell to thematic leadership. The chart of the Bloomberg Commodities Index (BCOM) was rallying in the spring and has pulled back in the near-term. Where it goes from here is a hint as to where investors might turn when they do finally take some money out of the big Growth sectors. If the BCOM can rally above near-term resistance, that would be an indication to favor resource adjacent sectors XLE and XLB. If the BCOM stays lower, we would expect XLY and several of the lower volatility sectors like XLLV, XLP and XLU to be favored.

- Bloomberg Commodities Index (200-day m.a. | RSI )
- The 108 level is key to signaling sustained bullish reversal for commodities prices, a key tactical signal for adding to natural resources exposure through XLE or XLB
Sources: Bloomberg
