


Monday finished with the Dow leading a mixed tape. The Dow Industrials continued their positive mean-reversion behavior in the near-term adding 0.67% while the S&P 500 gave up 0.31% and the Nasdaq slipped 1.09% as investors extended NVDA’s three day slide down another 6.68%. No obvious catalyst for the sharp sell-off, but profit-taking is a leading suspect until others emerge.
The US 10yr Treasury Yield edged lower by 1.1 bps to 4.25%, while WTI Crude added 1.1% to settle at $81.67.
CoreLogic real estate price indices and conference board surveys highlight a busy economic calendar on Tuesday as S&P 500 constituents CCL and FDX report before and after the bell respectively.
Futures for the Nasdaq are up slightly early in the session as of this writing.
Eco Data Releases | Tuesday June 25th, 2024
| Date Time | Event | Survey | Actual | Prior | Revised | |
| 06/25/2024 08:30 | Philadelphia Fed Non-Manufacturing Activity | Jun | — | — | -0.6 | — |
| 06/25/2024 08:30 | Chicago Fed Nat Activity Index | May | -0.25 | — | -0.23 | — |
| 06/25/2024 09:00 | FHFA House Price Index MoM | Apr | 0.30% | — | 0.10% | — |
| 06/25/2024 09:00 | S&P CoreLogic CS 20-City MoM SA | Apr | 0.30% | — | 0.33% | — |
| 06/25/2024 09:00 | S&P CoreLogic CS US HPI YoY NSA | Apr | — | — | 6.49% | — |
| 06/25/2024 09:00 | S&P CoreLogic CS 20-City YoY NSA | Apr | 7.00% | — | 7.38% | — |
| 06/25/2024 10:00 | Conf. Board Consumer Confidence | Jun | 100 | — | 102 | — |
| 06/25/2024 10:00 | Conf. Board Present Situation | Jun | — | — | 143.1 | — |
| 06/25/2024 10:00 | Conf. Board Expectations | Jun | — | — | 74.6 | — |
| 06/25/2024 10:00 | Richmond Fed Manufact. Index | Jun | -3 | — | 0 | — |
| 06/25/2024 10:00 | Richmond Fed Business Conditions | Jun | — | — | -9 | — |
| 06/25/2024 10:30 | Dallas Fed Services Activity | Jun | — | — | -12.1 | — |
S&P 500 Constituent Earnings Announcements by GICS Sector | Tuesday June 25th, 2024

Tactical Tuesday: What do we do with NVDA?
The world’s biggest money maker is in trouble off more than 13% over the past three sessions. And yet, the stock has doubled the performance of the S&P 500 YTD despite the sharp near-term drawdown. The chart would suggest ideal accumulation is at the March highs near the $100 level. The uptrend remains intact above the $75 level. We expect this will be seen in hindsight as an accumulation opportunity and would be ready to start accumulating on weakness in a matter of days if the sell-off continues.
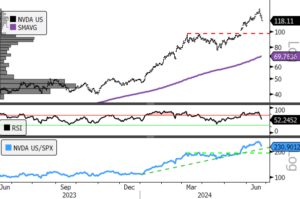
- NVDA (200-day m.a. | Relative to S&P 500)
- Accumulatio is likely to occur near the $100 level. Absent the emergence of fundamental catalyst, we are chalking the correction up to profit taking after the recent stock split.
Sources: Bloomberg
