
Our Elev8 Sector Rotation model entered August triggering some risk-off signals. We have since had a roughly 10% correction in the S&P 500 and are in the midst of a sharp upside bounce off recent lows. In the last few days, we have seen our short in XLY hurt performance, but the trend following model is still short of bullish reversal.
We wanted to point out the thresholds that trigger signal change for our model while freely admitting it has been a difficult period to navigate due to concurrent expectations of deteriorating economic conditions and expected policy remedies. We remain long lower volatility sectors XLU, XLP, XLRE and XLV. We are short XLE, XLB and XLY. Of those three, the XLY position is showing the most positive improvements in the near term.
At present, intermediate-term price structures are still challenged for the S&P 500, the XLY and the XLK. Below are key thresholds on the chart that trigger bullish reversal signals for our model inputs.
S&P 500 Trading into Resistance
The August 1 intra-day high of 5566 represents a horizontal break-out for S&P 500 as price congestion alleviates above that level. We expect on any upside buy signal, there will likely be a near-term period of retracement from overbought conditions. But an S&P 500 break-out above 5566 will have us begin covering shorts in higher-beta sectors, particularly XLK and XLY.
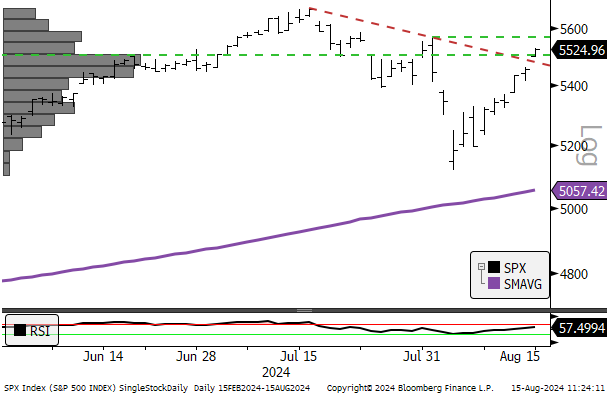
- S&P 500 daily, June 1st– present (200-day m.a.)
XLY Trading into Resistance
Near term downward moves in interest rates is projected to have a salubrious effect on the Consumer, but the current conditions have been short of desirable. The inflation rate is easing, but Consumers have been hit by 3+ years of large cost increases since the pandemic came and went. The housing market still suffers from a structural lack of supply, and all though wages have grown faster than inflation over the past 12 months, that doesn’t address the multi-year prior period where prices surged.
The chart below shows the XLY trading into resistance. 185 and 188 are key levels for the XLY. Moves above show progress in a more durable bullish reversal price structure. But keep in mind the long-term performance downtrend vs. the S&P 500. Not all is well here.
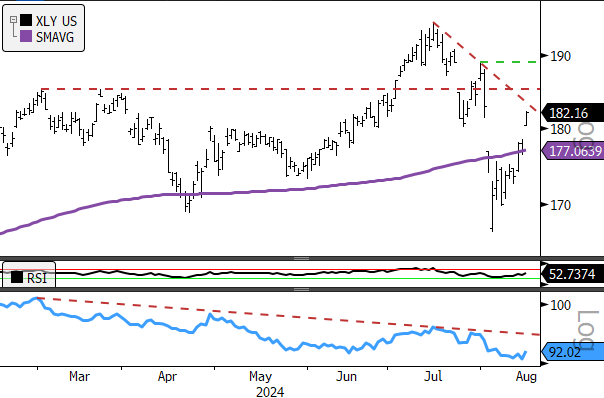
- XLY daily, 6-months (200-day m.a. | Relative to S&P 500)
- $185 and $188 are key levels on the chart to show progress on a durable bullish reversal
XLK Trading into Resistance
XLK price is hitting the $220 level today, right at the previous near-term high at the end of July. Given the recent 20% decline in the SPDR, we would expect more consolidation. We have a tactical 2% Underweight in XLK for August. We are maintaining that position for now.
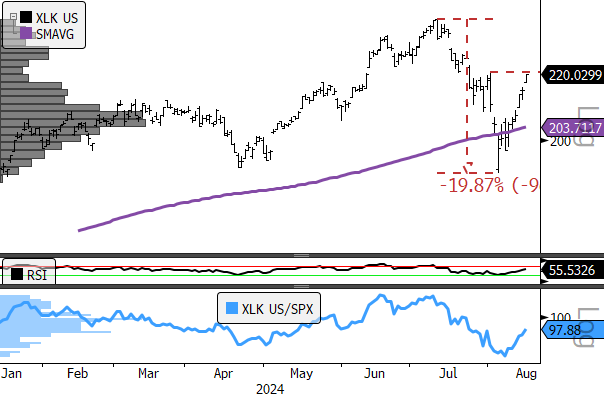
- XLK daily, YTD (200-day m.a. | Relative to S&P 500)
- Undercutting the April low in August undermines the longer-term bullish pattern and has us looking at the current rally as part of an ongoing consolidation at this time
Data sourced from Bloomberg
