



Performance Overview
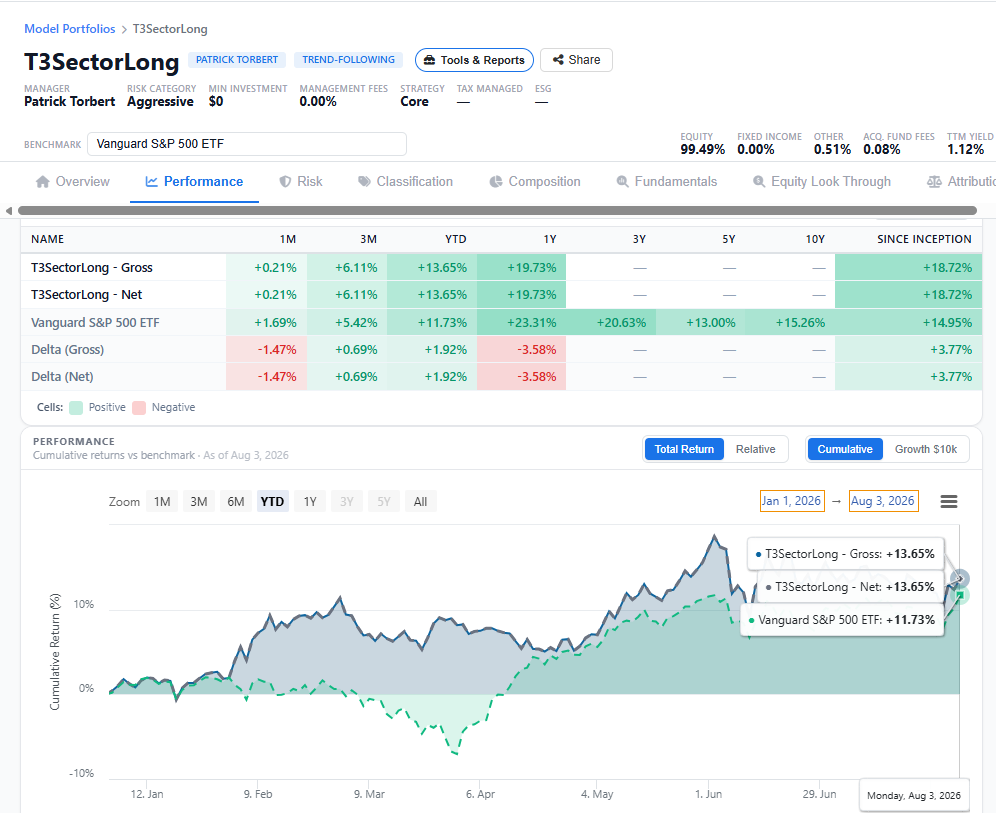
The ETFSector.com Top3 Sector Model remained ahead of the Vanguard S&P 500 ETF benchmark in 2026 despite a difficult July. The model returned 12.37% year to date, compared with 10.16% for the benchmark, generating 221 basis points of excess return. Performance was not a straight-line win: cyclical exposure worked early in the year, the April rotation into Information Technology captured the next phase of market leadership, and July exposed the risk of allowing one sector to dominate the portfolio.
The model declined 2.76% in July, while the benchmark was nearly unchanged, creating 274 basis points of monthly underperformance. Even after that setback, the model retained positive excess returns of 110 basis points over three months and 174 basis points over six months. These results indicate that the broader 2026 rotation process added value, although the size and timing of the July positions reduced the advantage. The trailing one-year result remains weaker, with the model returning 16.37%, versus 19.58% for the benchmark.
Review: Top3 Performance vs. S&P 500 (VOO) | YTD
Review: Top3 Dashboard | July 2026
Review: Top3 Positions | July 2026
Risk Profile
Since inception, the model generated a 19.86% annualized return, compared with 17.94% for the benchmark. That advantage came with higher volatility: standard deviation was 14.38%, versus 12.60%, while tracking error was 13.42%. These statistics are consistent with a concentrated active-sector strategy rather than a benchmark-like allocation.
Active risk has not simply translated into greater market sensitivity. The model’s beta was 0.581, while downside capture was 39.11%. Historically, the strategy participated in substantially less of the benchmark’s losses during negative periods. Its 81.40% upside capture shows that it also did not participate fully in every market advance. The trade-off is clear: the model can produce differentiated returns and favorable downside participation, but it can lag sharply when excluded sectors or benchmark mega-cap stocks lead.
2026 Attribution
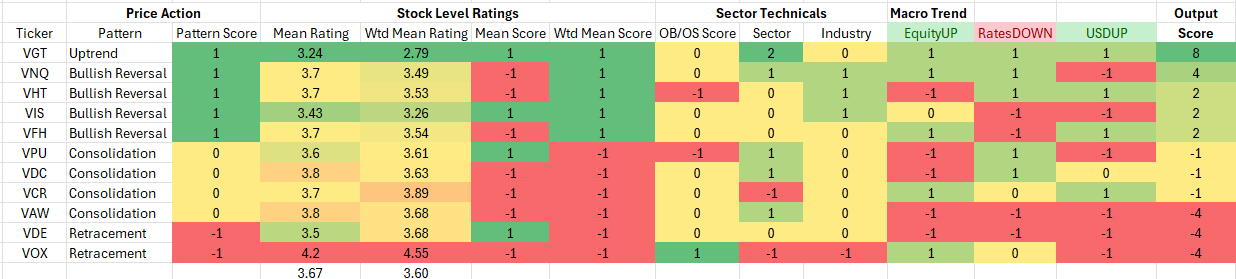
The principal source of 2026 excess return was sector allocation rather than security selection because the strategy invests through sector ETFs. Early-year positions in Energy, Materials and Industrials captured the cyclical and reflation-oriented phase. The late-April pivot into Information Technology then aligned the portfolio with renewed growth leadership.
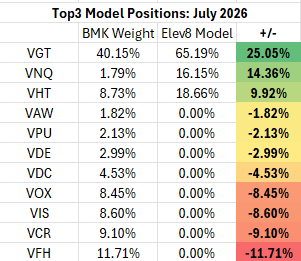
The same Technology position became the largest July detractor after rising to 64.34% of the portfolio. Health Care and Real Estate served as diversifiers, but neither contributed enough to offset the Technology reversal. July therefore illustrated both the strength and risk of the Top3 process: concentration can add significant value during persistent leadership trends but creates meaningful relative-performance risk when leadership broadens or reverses.
August Positioning
The August rebalance broadens the portfolio across Information Technology, Financials and Industrials. Technology remains the largest sleeve at 49.61%, but its weight is materially lower than in July. Financials enter at 27.58% as the highest-scoring sector, while Industrials receive 22.81%, restoring cyclical breadth.
The portfolio remains decisively growth-and-cyclical. Its results will depend on continued leadership from these three sectors, while zero exposure to the other eight sectors remains the principal active risk. Overall, the rebalance improves attribution balance without abandoning the model’s highest-conviction signals.
Model results are hypothetical and provided for informational purposes. Past performance is not indicative of future results.
