
We look closely at sector and industry trends each month as we evaluate positioning based on our technical and macro level trend following process. Typically, we focus our reports on one sector at a time. This Industry highlight report takes a broad view of the 11 GICS sectors at the industry level to highlight areas of strength and weakness. As equities churn ahead of the election, we are looking for signs of new durable leadership themes emerging in the wake of Mag7, semiconductors, AI and Housing. This report should help us ID new leadership at early stages of its trend.
Energy Sector: 1 year
We can see broad weakness across Energy Sector (Chart below, Top panel), Industries (2nd panel) and Sub-Industries (3rd panel). The lone bright spot in the sector has been Storage and Transport which is home to high dividend paying companies and MLPs like OKE, KMI, WMB and TRGP.

Energy Sector: Quarter-to-date
Since July 1, which encompasses the nascent rotation away from Mega Cap. Growth, we haven’t seen any positive change in the Energy Sector’s performance profile. The Storage and Transport Sub-Industry continues to be an alpha source, while the rest of the sector continues to lag. We remain negative in our outlook on XLE, but we are constructive on MLP’s and the Storage and Transport Sub-Industry

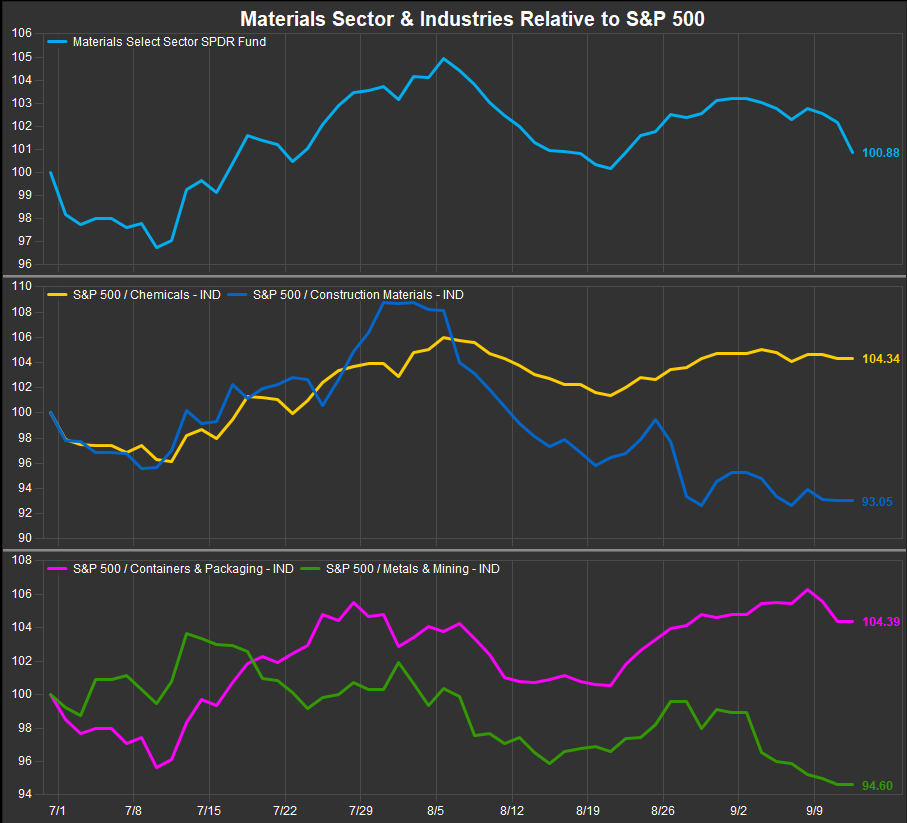
Materials Sector: 1 year
The Materials Sector is, unsurprisingly, also having a difficult time sustaining any outperformance. At the Industry level there are no big stand-outs with Containers & Packaging the strongest performer over the past 12 months. Given the downtrend in commodities prices in 2024 we are not surprised by weakness in XLE and XLB. Historically, the direction of Commodities prices is powerful coincident indicator.

Materials Sector: Quarter-to-date
In contrast to the Energy Sector, the Materials Sector has shown some signs of life over the most recent quarter. The Chemicals Industry, the largest in the sector by market cap., has outpaced the S&P 500 by >4% since July 1 contributing to modest outperformance from the sector in aggregate. Construction Materials and Mining industries continue to lag, but given 2 out of 4 Industries have turned positive over the past quarter, we see improvement in the Sector though it still is near the bottom of our rankings. The strongest chart in the Chemicals Industry based on our work are LIN, SHW and ECL. We also like PKG and AMCR in the Containers & Packaging Industry
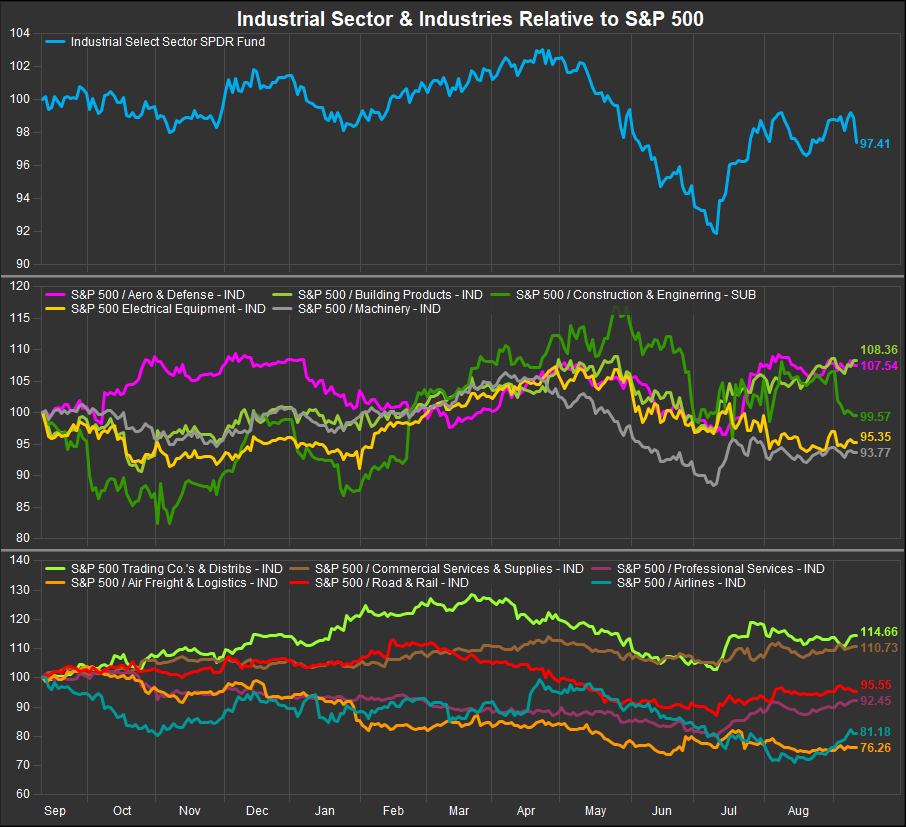
Industrial Sector: 1 year
The Industrial Sector, similar to the Discretionary Sector, is home to a broad array of industries that often perform well at different parts of the business cycle. This is a sector that an Industry focused trading strategy could potentially add some value to. We can see (chart, below) over the trailing 12-months that there is broad dispersion in performance with Aero/Defense, Building Products, Trading co.’s and Commercial Services all beating the S&P 500 by >5% over the past year while Air Freight and Airlines have been particularly weak.
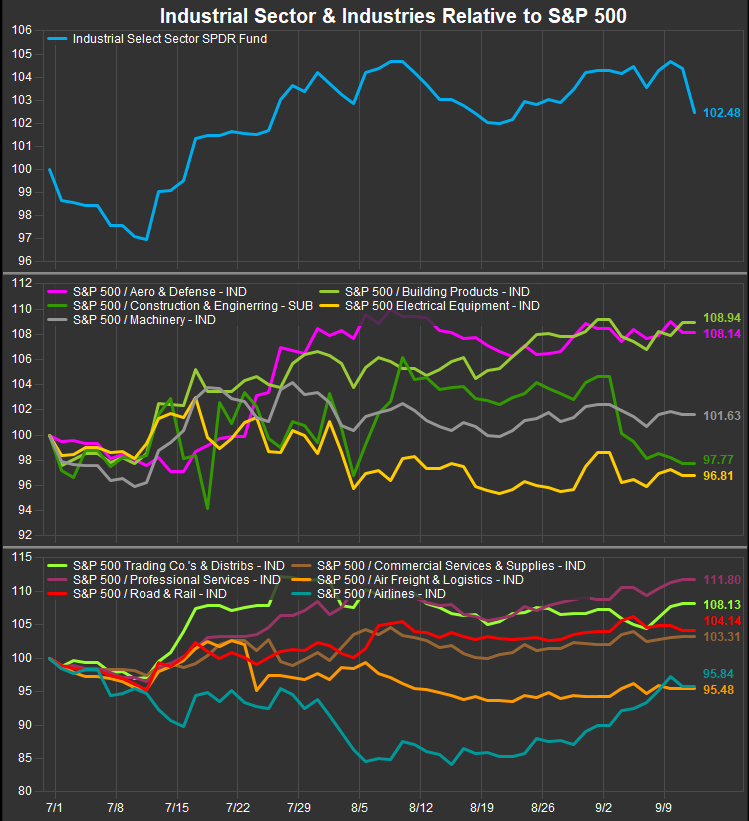
Industrial Sector: Quarter-to-date
QTD the sector has improved, with 7 of 11 industries outperforming since July 1. Professional Services, Building Products and Aero/Def have been strong. The former and the latter of those 3 are typically ascendant when lower beta factors are leading, while housing continues to look like a potential leadership theme across sectors. Airlines, an early cyclical, have seen notable improvement off the August low, and bear watching. We continue to prefer Industrials to Energy and Materials based on our Elev8 Model inputs.
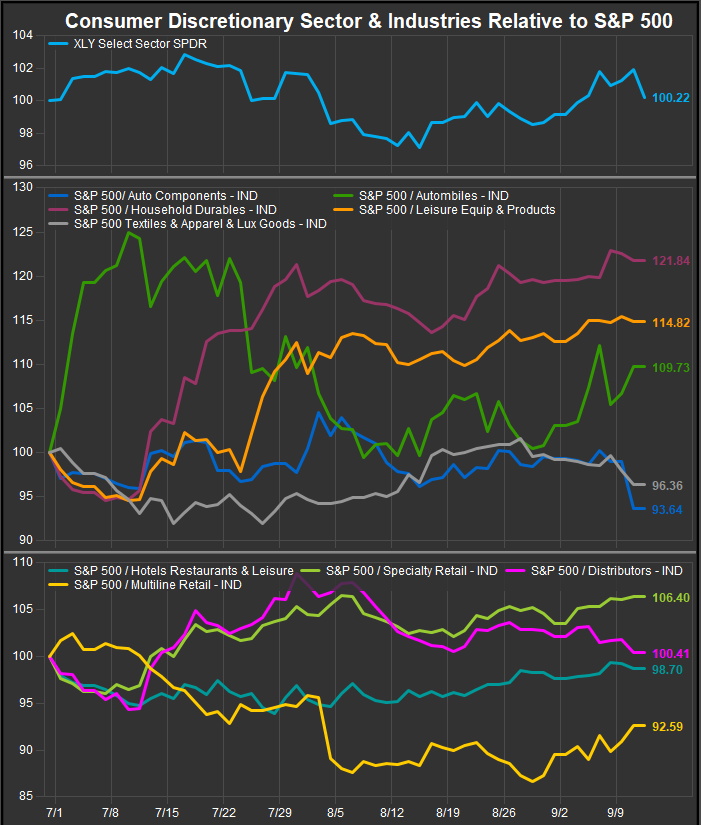
Consumer Discretionary Sector: 1 year
The Discretionary Sector has been challenged since the calendar flipped to 2024. Broad-based strength at the industry level has been elusive. Household durables, buoyed by homebuilders has been a clear leadership group, with broad participation at the stock level. Multi-line retail, driven by AMZN has been the only other industry to outperform the S&P 500 over the past 12-months. If there are signs of thematic rotation, one would think the average stock in the Discretionary space would start show some improvement.

Consumer Discretionary Sector: Quarter-to-date
We are in fact seeing some improvement across industries QTD. Household Durables continue as leadership, but Leisure Products, Automobiles and Specialty Retail have improved. We need to see the sector making a multi-month relative high above the 7/15 level to get incrementally more constructive. The Elev8 model has a trading short on the sector at present due to weak seasonals, falling interest rates and consolidation at the index level, but if the bull market endures, we are likely to want long exposure in XLY into the end of the year. We will post the buy signal if/when it develops.
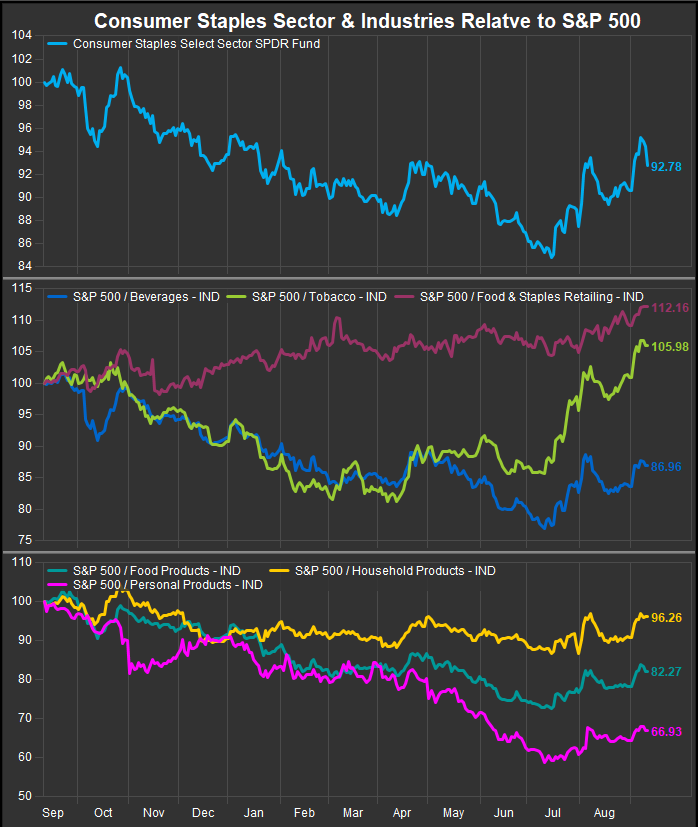
Consumer Staples Sector: 1 year
There has been a clear shift in the performance of the Consumer Staples sector over the past 3-months. Equities have consolidated with rates moving lower which has generally been a tailwind to the lower vol., higher income sectors. Leadership persists with the Food & Staples Retailing Industry. WMT and COST are clearly the two strongest stocks in the sector over the past 12-months. Tobacco stocks have also been a haven. Further outperformance is likely “path dependent” on the direction of the S&P 500. Staples traded to near-term relative highs at the beginning of September. We are currently out of the sector as it grades as the weakest low vol. sector exposure in our work, but being short has hurt MTD. We would likely get a buy signal for the sector if the S&P 500 broke lower from its current consolidation.
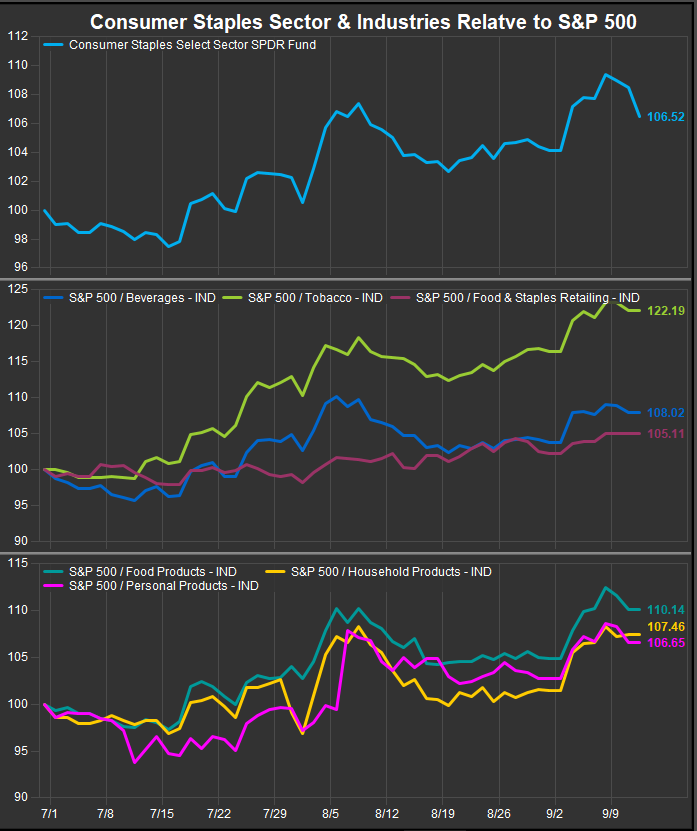
Consumer Staples Sector: Quarter-to-date
QTD is where we are seeing evidence of risk-off leadership. All 6 Industries within the Staples sector have outperformed since July 1 and have broken out to new relative highs in September. This has been a similar theme across Utilities and REITs as well. We have been slow to embrace this as a long-term message since the long-term trend in equity prices is still bullish, but we have been allocating to safety given the downward trajectory of interest rates and commodities prices.
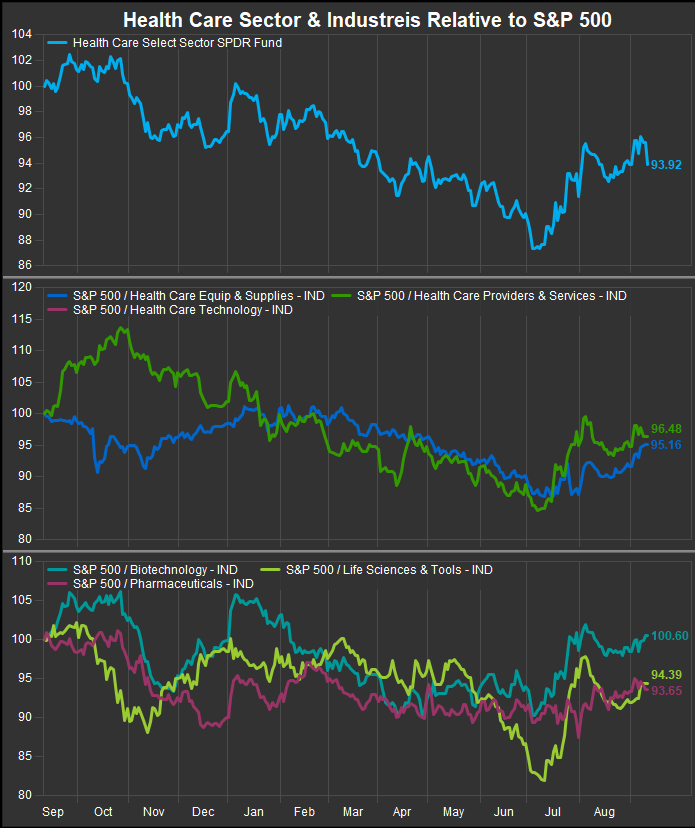
Health Care Sector: 1 year
The Healthcare Sector has traded very similarly to the Staples sector. Most industries were lagging into July and have since manifested bullish reversal on price and relative to the S&P 500 Index. Biotechnology has been the best performing industry over the longer term. Our favorite stocks in the space are REGN and VRTX. We are also constructive on ABBV and AMGN.
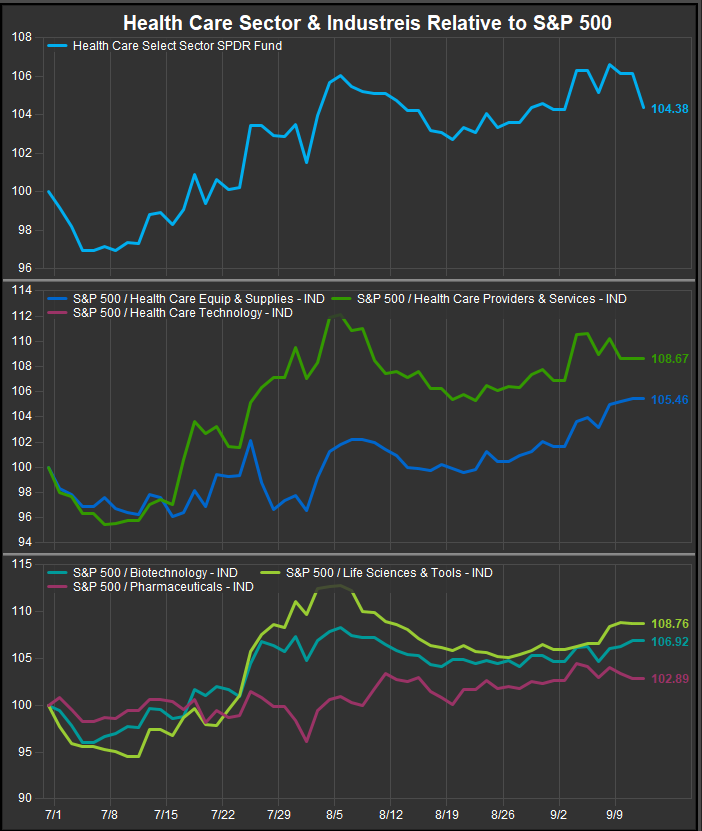
Health Care Sector: Quarter-to-date
QTD, Health Care has benefitted from rotation into lower vol. instruments and the “reach for yield” dynamic that accompanies the potential onset of interest rate policy easing. All 5 HC sector industries are outperforming since July 1. With all of the newly sought after defensive sectors our concern is there wasn’t much improvement in the stocks before interest rate policy became a central focus. We are skeptical that these sectors have the ability to lead long term absent the advent of recession. Typically, the resolution of the presidential election pushes prices higher into year-end from the beginning of November.
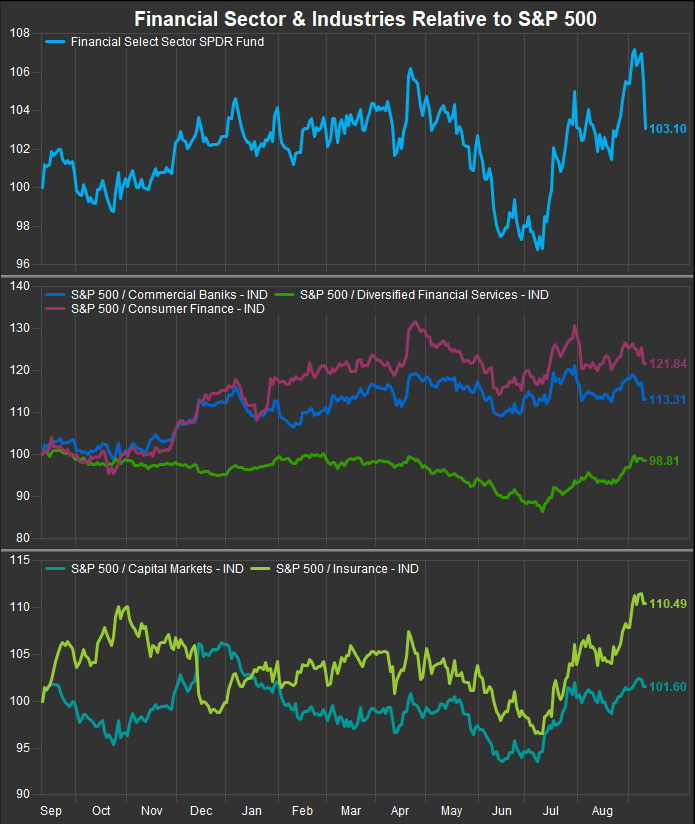
Financial Sector: 1 year
We have been fans of the Financial sector as it started improving in our work well before the current quarter kicked off consolidation. Over the past 12 months 4 of 5 industries have outperformed within the sector and the lone laggard is off by <1% vs. the benchmark S&P 500.
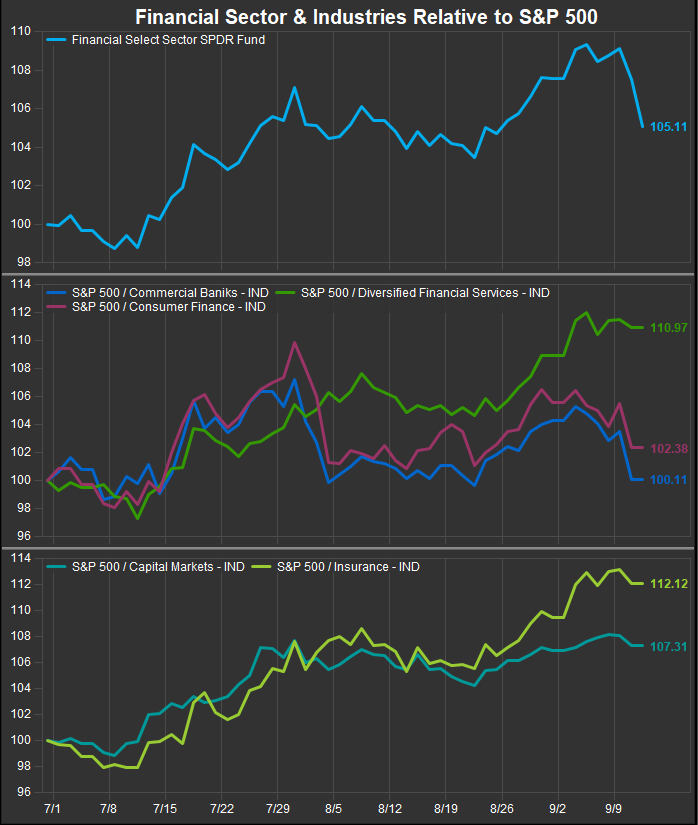
Financial Sector: Quarter-to-date
Since July 1 we are seeing cyclical weakness in Commercial Banks and Consumer Finance industries. Those are typically higher beta Value focused groups of stocks. Those peaked in May and have consolidated sideways since. However, as the chart below shows, Insurance stocks and Capital Markets stocks have taken the baton in the near term as the market has clearly shifted to a preference for income and lower volatility.
Information Technology Sector: 1 year
The biggest question/challenge in our work and in our model portfolio positioning is deciding how to evaluate retracement of gains in the Info Tech. sector. Historically the sector leads in bull markets and by a wide margin. That was the case from January 2023 to July 2024. Now that we’re in the midst of a seasonal pull-back, the sector’s performance is challenged, but we note the relative line is back to where it was in September/October of 2023 when the Index washed out and triggered a powerful contrarian buy signal. Semiconductors are the story at the industry level. They have beaten the S&P 500 by 40% over the past 12 months but have lagged by 14% since July 1. They are a victim of their own success at this point.
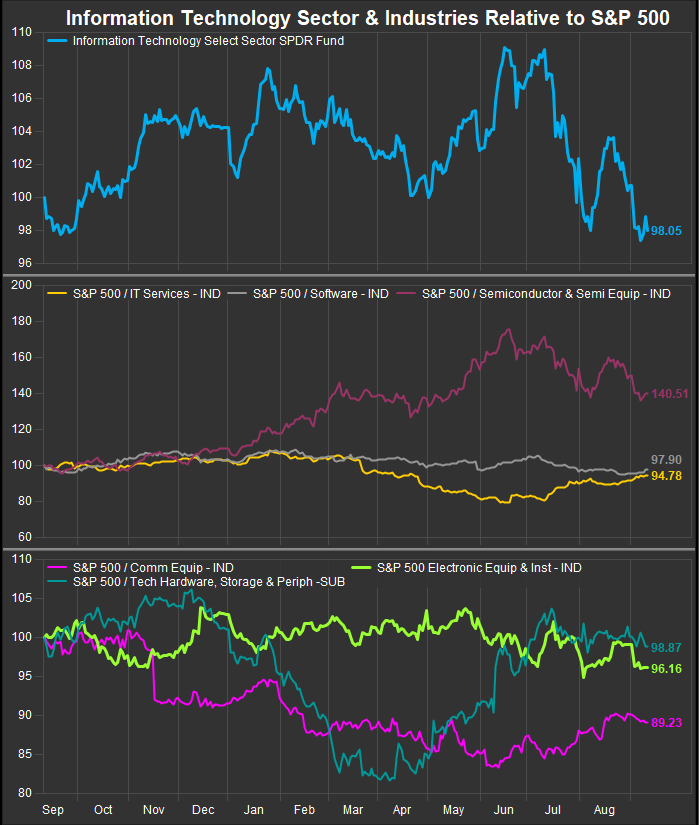
Information Technology Sector: Quarter-to-date
Leadership within the sector has shifted away from Semiconductor stocks since July 1. IT services, which have been a laggard in this cycle, Comm. Equipment and Hardware stocks have improved performance, but can’t fully ameliorate the selling in Semi’s. We are looking for support to hold in absolute and relative terms. At the stock level we expect NVDA will eventually be accumulated as it is now off almost 30% from its high of the year and at an oversold level.

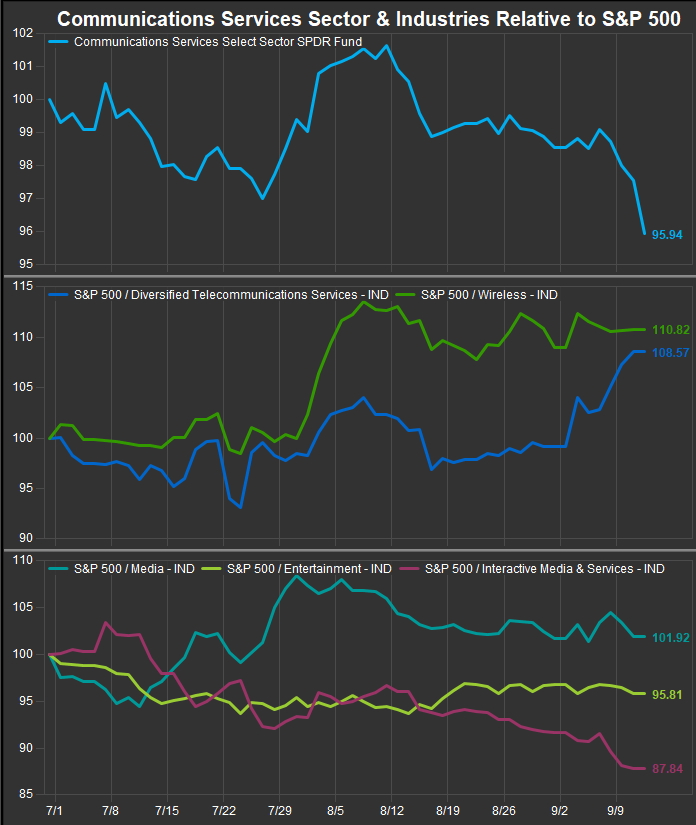
Communications Services Sector: 1 year
Similar to Tech, the Communications Services Sector has struggled in the near-term in aggregate. The 1yr chart below shows near-term resurgence in Wireless and legacy Telecom Industries at the expense of Interactive Media & Services (where META and Alphabet reside). Those two mega cap.’s still chart well and look buyable to us despite the current correction.
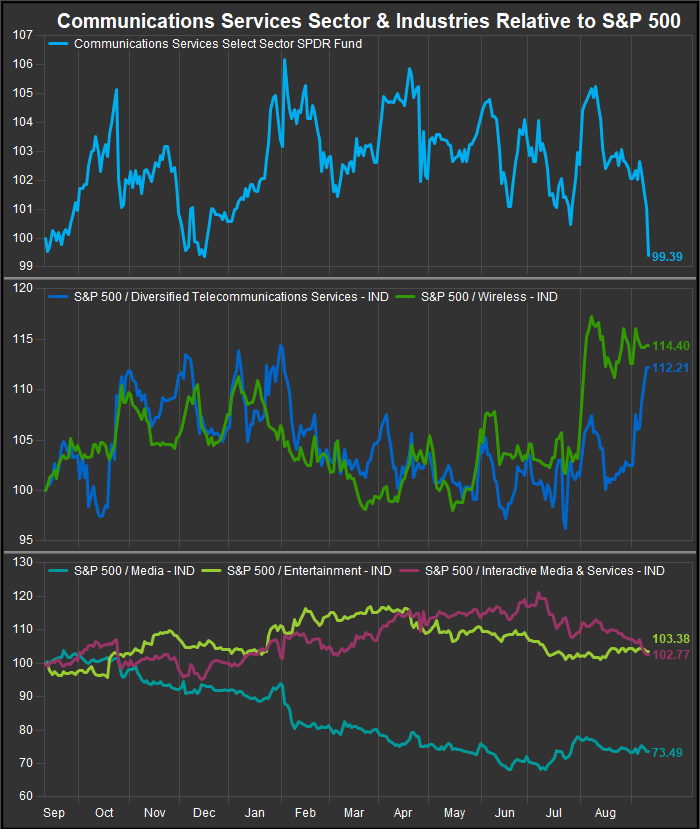
Communications Services Sector: Quarter-to-date
Looking at the QTD chart below, we can see the reach for yield is real as even long-term out of the money stocks like VZ and T are getting bought in the near-term. Media, which has been a long-term laggard as well, briefly improved and Wireless (which is a single stock, TMUS) has been strong near-term as well.
Utilities Sector: 1 year
Utilities have been a rotation beneficiary, and unlike Staples, Real Estate and Healthcare, the sector began outperforming well before July 1. That’s a plus in our work as we like organic turnarounds better than event driven outperformance and we feel a lot of the low vol. outperformance since July has been driven by investors front-running Fed policy.
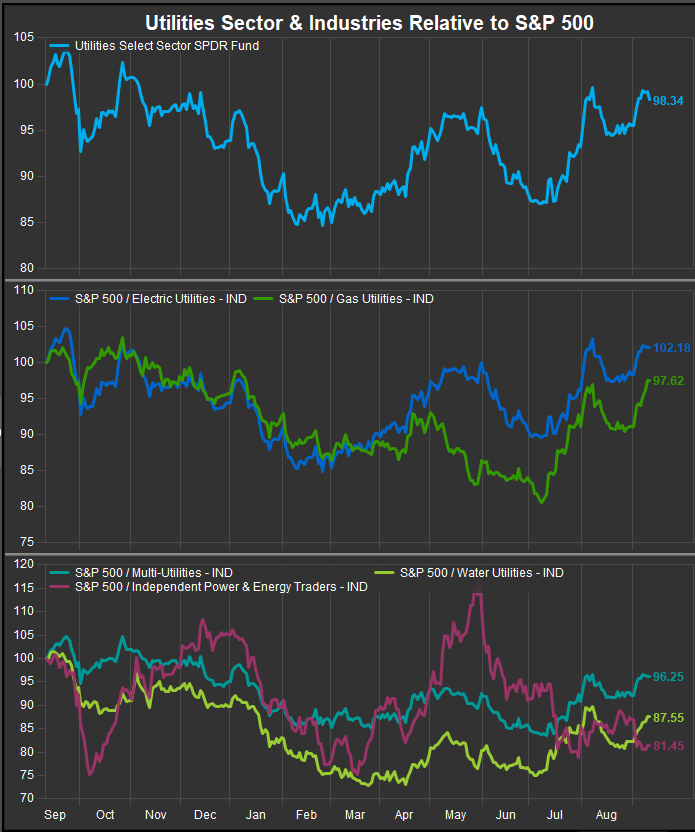
Utilities Sector: Quarter-to-date
QTD the Utilities Sector confirms risk-off leadership as the 2nd best performing sector over that timeframe. At the stock level there are very few standout stocks in the sector. The average stock is driving near-term improvements as previous standouts CEG and VST are not driving relative gains.

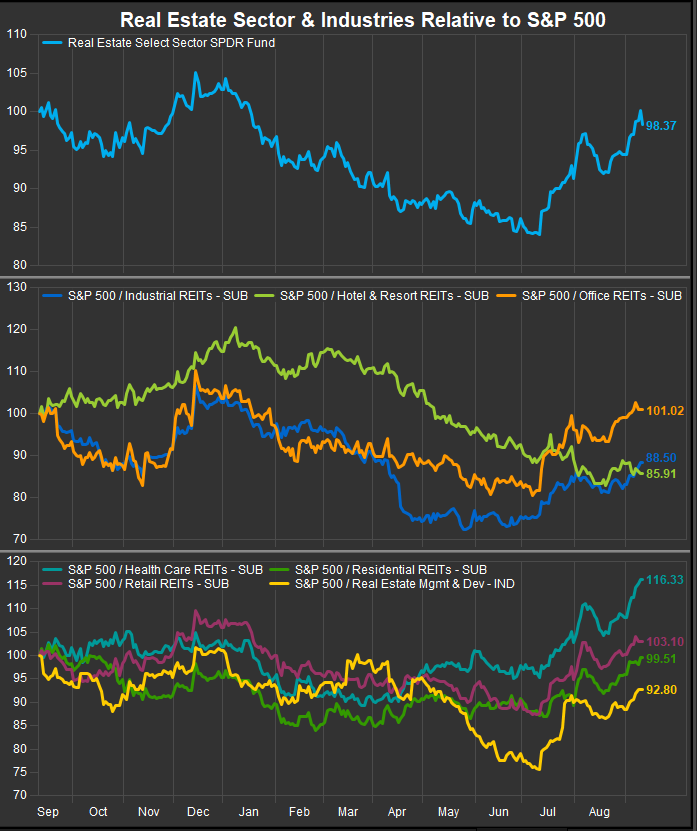
Real Estate Sector: 1 year
The Real Estate Sector has been the biggest beneficiary of near-term rotation. It boasted all the hallmarks as it was a structural laggard sector that features a high dividend yield. Now that Fed policy easing is consensus previous inflationary headwinds have instead become tailwinds.
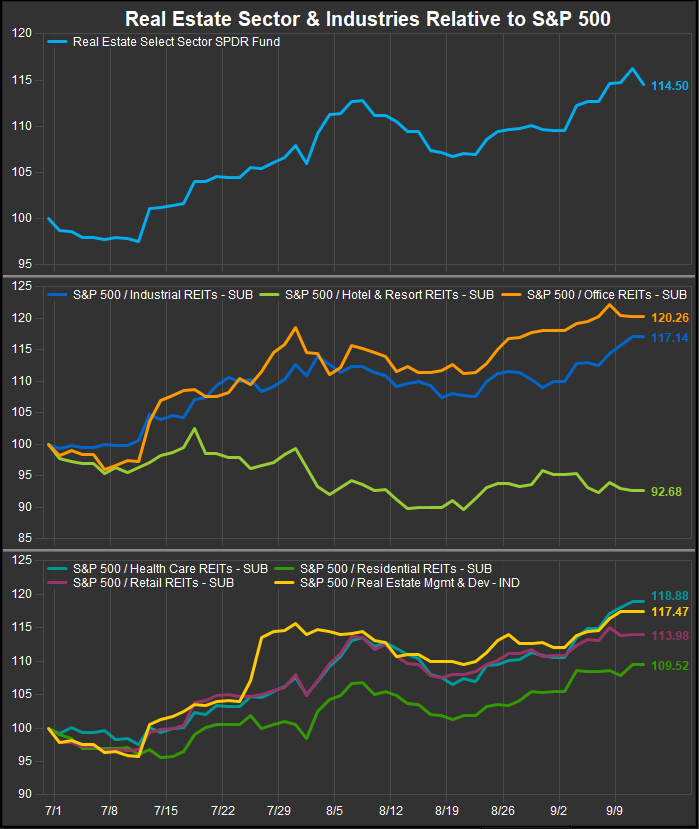
Real Estate Sector: Quarter-to-date
6 out of 7 Real Estate industries have outperformed since July. Only the Hotel & Resort group has failed to keep pace with the S&P 500. Real Estate and Utilities have been our two best scoring defensive exposures since rotation and consolidation began and we look forward to seeing how they act if the bull market trend re-establishes itself, as historically REITs score positively in equity uptrends despite weakness since the Global Financial Crisis 15 years ago.
Conclusion
There has been a clear preference for Yield and Lower Vol. exposures since July 1. We find Real Estate, Utilities, Staples and Healthcare are leading in the near term. Commodities linked sectors have been the weakest group overall and we think the Semiconductor correction will eventually be seen as a buying opportunity if the economy doesn’t completely tank into the end of the year. Direction of rates should give us a clue. At some point they should go low enough to spark equities higher, and we would expect that will be the low for rates when that occurs.
Source: FactSet Data Systems
