October positioning
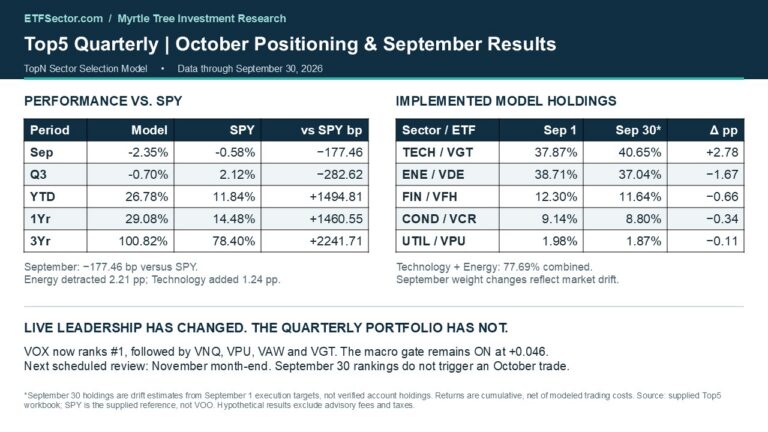
Top5_Quarterly enters October with the five-sector allocation established on September 1: Energy, Information Technology, Financials, Consumer Discretionary and Utilities. Energy remains the principal active overweight, although Technology has become the largest holding through market appreciation. The model has not rotated into September’s new signal leaders. Its next scheduled review uses the November month-end signal for execution on the following trading day.
That distinction matters after a difficult September. Communication Services now ranks first, while Energy has fallen to seventh and Financials and Consumer Discretionary have slipped to ninth and tenth. The quarterly schedule preserves the established portfolio between reviews, giving the model time to capture sustained sector trends while accepting the risk that leadership changes before the next rebalance.
| Sector | ETF | Sep 1 target | Sep 30 estimate | Change pp |
| Technology | VGT | 37.87% | 40.65% | +2.78 |
| Energy | VDE | 38.71% | 37.04% | −1.67 |
| Financials | VFH | 12.30% | 11.64% | −0.66 |
| Consumer Discretionary | VCR | 9.14% | 8.80% | −0.34 |
| Utilities | VPU | 1.98% | 1.87% | −0.11 |
September 1 targets are post-rebalance model weights. September 30 estimates apply each ETF’s adjusted-price change from the September 1 execution date and normalize to 100%. Changes reflect market drift, not an additional trade. Model estimates do not represent verified account holdings. The six other sectors remain unheld.
Why Energy remains the active position
Energy ranked first at the August 31 signal, with a score of +0.59. Under the enhanced Top5 rule, the highest-ranked sector receives the capital removed from the six excluded sectors. Ranks two through five generally retain their benchmark sector weights. This produced a 38.71% Energy target alongside 37.87% Technology, 12.30% Financials, 9.14% Consumer Discretionary and 1.98% Utilities. The 70% single-sector cap did not bind.
By September 30, Energy’s estimated weight had declined to 37.04%, while Technology rose to 40.65%. Together they represent 77.69% of the portfolio. The model therefore remains highly dependent on two different earnings drivers: the commodity and cash-flow outlook for energy producers, and the durability of technology investment and profits. Five holdings should not be mistaken for equal diversification across five sectors.
What the live rankings are saying
The current top five are Communication Services, Real Estate, Utilities, Materials and Technology. The first and fifth use trend-following scores; the three others use oversold-reversal scores. The current list therefore combines relative strength with potential recovery opportunities. It is a monitoring signal for the next review, not an October allocation instruction. The macro gate remains ON, but its margin above the activation threshold has narrowed substantially.
September performance review
Top5_Quarterly returned −2.35% in September, versus −0.58% for SPY, a shortfall of 177.46 basis points. The Energy overweight detracted as the sector declined, Financials and Consumer Discretionary also weakened, and the portfolio lacked Communication Services as that sector advanced. Technology provided a substantial offset, but its gains were insufficient to absorb losses elsewhere.
| Period | Top5 Quarterly | SPY reference | Performance vs SPY bp |
| September | -2.35% | -0.58% | −177.46 |
| Q3 | -0.70% | 2.12% | −282.62 |
| YTD | 26.78% | 11.84% | +1494.81 |
| 1Yr | 29.08% | 14.48% | +1460.55 |
| 3Yr | 100.82% | 78.40% | +2241.71 |
Calendar-period cumulative returns through September 30, 2026. One year covers October 1, 2025 through September 30, 2026; three years covers October 1, 2023 through September 30, 2026. The workbook uses SPY and contains no VOO return series. These figures are not presented as VOO returns. Strategy results include the workbook’s modeled trading costs and exclude advisory fees and taxes.
The third quarter was also challenging: the model declined 0.70%, while SPY gained 2.12%, leaving a 282.62-basis-point shortfall. The broader record remains stronger. Year to date, the model gained 26.78%, versus 11.84% for SPY. Over one year, returns were 29.08% and 14.48%, respectively. Three-year cumulative returns were 100.82% for the model and 78.40% for SPY, equivalent to approximately 26.16% and 21.28% annualized.
The recent setback leaves the longer-period advantage intact, but highlights the cost of concentrating capital in one ranked leader. The quarterly schedule can retain a sector after its score weakens. Investors must weigh the longer-period benefit against episodes such as September.
What drove September returns
| Source of return | Contribution pp |
| Technology (VGT) | +1.24 |
| Energy (VDE) | −2.21 |
| Financials (VFH) | −0.83 |
| Consumer Discretionary (VCR) | −0.47 |
| Utilities (VPU) | −0.11 |
| Other sectors held on September 1 | +0.06 |
| Modeled cost and reconciliation | −0.04 |
| Total strategy return | -2.35% |
Contributions sum to the strategy’s compounded monthly return before rounding. The prior portfolio earns the September 1 return in the workbook; the new allocation begins earning returns on September 2. That is why Materials, Health Care and Consumer Staples appear in monthly attribution despite having no September 30 holding.
Energy contributed approximately −2.21 percentage points, Financials −0.83 and Consumer Discretionary −0.47. Technology added +1.24 points. The workbook’s latest rebalance-period return of roughly −1.54% excludes the September 1 return from the prior allocation and therefore is not the full calendar-month result. This report consistently uses the daily performance series for calendar returns.
Sector scores and macro indicators
The score grid compares the August 31 signal that established the September portfolio with September 30’s live readings. Higher scores rank better within the model, but the economic interpretation depends on the sector’s signal profile. Momentum sectors favor persistent relative strength; reversal sectors can rise in rank after underperforming.
| Sector ETF | Signal | Aug score | Sep score | Aug rank | Sep rank |
| VOX Communication Services | Trend | −0.68 | +1.71 | 7 | 1 |
| VNQ Real Estate | Reversal | −0.87 | +1.53 | 9 | 2 |
| VPU Utilities | Reversal | +0.08 | +1.35 | 3 | 3 |
| VAW Materials | Reversal | −0.16 | +0.62 | 6 | 4 |
| VGT Technology | Trend | −0.13 | +0.53 | 5 | 5 |
| VDC Consumer Staples | Reversal | −0.73 | +0.35 | 8 | 6 |
| VDE Energy | Trend | +0.59 | +0.25 | 1 | 7 |
| VHT Health Care | Reversal | −1.90 | −0.15 | 11 | 8 |
| VFH Financials | Trend | +0.41 | −0.72 | 2 | 9 |
| VCR Consumer Discretionary | Trend | −0.11 | −1.75 | 4 | 10 |
| VIS Industrials | Trend | −1.04 | −1.90 | 10 | 11 |
VOX moved from seventh to first as its trend score improved from −0.68 to +1.71. VGT remained fifth, with a stronger score of +0.53. VNQ rose from ninth to second and VAW from sixth to fourth through reversal signals. Their higher rankings do not establish improving price trends: VNQ fell 7.06% in September and VAW fell 7.70%. Utilities retained third place despite a 6.49% decline, illustrating the same oversold-recovery logic.
A positive macro gate with weaker confirmation
| Indicator | August 31 | September 30 |
| Growth | 0.458 | 0.292 |
| Inflation | 0.722 | 0.889 |
| Liquidity | 0.600 | 0.533 |
| Risk | 0.667 | 0.476 |
| Breadth | 0.417 | 0.167 |
| Credit | 1.000 | 1.000 |
| Macro Risk Index | 0.612 | 0.548 |
| MRI 20-day momentum | 0.006 | -0.017 |
| Risk-on composite | 0.161 | 0.046 |
The risk-on composite fell from 0.161 to 0.046, still above the zero threshold. Growth, Risk, Liquidity and Breadth weakened; Credit remained at its maximum reading of 1.00. Credit measures HYG relative to LQD, so strong credit confirmation can coexist with falling bond prices when HYG holds up better than LQD. It should not be read as evidence that all credit conditions are improving.
Breadth declined from 0.417 to 0.167 and MRI momentum turned negative. Participation has narrowed even as selected large-cap sectors remain resilient. Inflation rose to 0.889, reflecting greater inflation, rate and commodity pressure rather than an unambiguously favorable growth backdrop. The composite continues to permit active concentration, but offers less cushion against further deterioration.
October market outlook and model discipline
October presents a tension between concentrated technology leadership and a more restrictive rate environment. In the supplied September data, VGT gained 4.30% and VOX gained 2.19%, while every other sector ETF declined. That concentration supports the improving Technology and Communication Services trend scores, but also explains why the model’s retained exposure to Energy, Financials and Consumer Discretionary lagged the market.
The Federal Reserve raised its policy range by 25 basis points to 3.75%–4.00% on September 16, citing elevated inflation alongside resilient spending and investment. In the model’s source data, the 10-year real yield ended September at 2.93% and the nominal yield at 5.27%. Higher discount rates make valuation support more demanding for long-duration growth stocks and raise financing pressure on property, utilities and consumer-sensitive businesses. [2]
Technology’s positive relative trend provides exposure to the AI investment cycle, but the key October test is whether spending translates into durable earnings and cash flow. Communication Services has stronger current momentum, yet the model will not gain exposure before its scheduled review under the supplied rules. For the held Energy position, commodity prices alone are insufficient: despite oil ending the month at $90.42 in the source data, VDE declined 4.45%. Equity performance also depends on margins, capital allocation and the sector’s relative earnings outlook.
The reversal signals in Real Estate, Utilities and Materials deserve a different interpretation. Higher rankings indicate that relative weakness has become more pronounced within the historical scoring framework. A recovery still needs support from stabilizing yields, better financing conditions or stronger demand. An oversold reading is not a substitute for improving fundamentals, and those sectors can continue weakening before a reversal develops.
How the model controls turnover and concentration
The model ranks sectors daily but schedules decisions at the end of February, May, August and November, with execution on the next trading day. This calendar is its principal filter against trading on every short-lived ranking change. The workbook does not specify the ten-day persistence and forecast-alpha tests used by the fixed income models. Those rules should not be imported into Top5_Quarterly.
At a scheduled review, a positive macro gate permits the enhanced Top5 allocation. The highest-ranked sector receives excluded-sector capital, subject to a 70% cap, with any excess redistributed across the other selected sectors. A gate that is OFF calls for benchmark sector weights rather than a cash allocation. September 30 is not a scheduled signal date, so neither the new leader nor the narrower macro reading constitutes an immediate trade.
Calculation notes and sources
Performance compounds Daily Performance returns over calendar periods, rather than using fixed 63-, 252- or 756-session windows from Rolling Performance. Three-year returns are cumulative. We omit risk statistics. Position estimates use the September 1 execution targets and subsequent adjusted ETF prices; September attribution includes the prior allocation’s September 1 return and the new allocation thereafter.
The Dashboard’s live target weights use the editable Sector Map benchmark weights, while Daily Signals uses a different benchmark-weight set. Both identify the same current top five, but their hypothetical percentages differ. This report uses the executed rebalance log for holdings and reports live scores and ranks without presenting either hypothetical target set as an October trade.
[1] Supplied ETFInsight Enhanced Top5 Sector Selection Model Refreshable With Profit Curve workbook, through September 30, 2026. Settings, Quarterly Rebalance Log, Daily Performance, Daily Signals, Indicator Descriptions and Source Data.
[2] Federal Reserve, September 16, 2026 FOMC statement. federalreserve.gov/newsevents/pressreleases/monetary20260916a.htm
Model results are hypothetical and do not represent actual trading. The workbook assumes trading costs of 3 basis points per side. Advisory fees, taxes and account-specific implementation costs are excluded. Concentrated sector allocations can underperform the market materially. Past model performance does not guarantee future results.