
Macro-Equities and Fixed Income Performance Remains Positively Correlated
One thing we’ve noticed during the post-election market action is stocks and bonds continue to see positive return correlation. The chart below tells the tale. This puts a lot of pressure on the Fed and we’d expect economic data to continue moving the tape.

Rates
We ID’d the 4.68-4.7% level as an important resistance level. Equities “head-faked” above that level in mid-January, but have since come back to retest near-term support. We think the 4.5-4.7% area continues to represent a pivot zone for the 10yr Yield, and, despite the recent false signal, we think the Growth led bull market will struggle if rates move higher, and would be supported if rates move lower.

Sectors: Technology Sector Starting to Look Vulnerable
Our sector fund performance chart (below) shows Technology shares (bottom panel) lagging in the near-term. We’ve also been a bit surprised by Utilities trading with Tech, as those stocks are perceived to be part of the AI “halo” effect for US equities. Defensive areas of the equity market (middle panel) lagged post-election, but since equities began consolidation in mid-December their performance has stabilized. Recently, Discretionary, Financials and Comm. Services have seen performance pick up while Commodities linked Sectors have improved modestly.

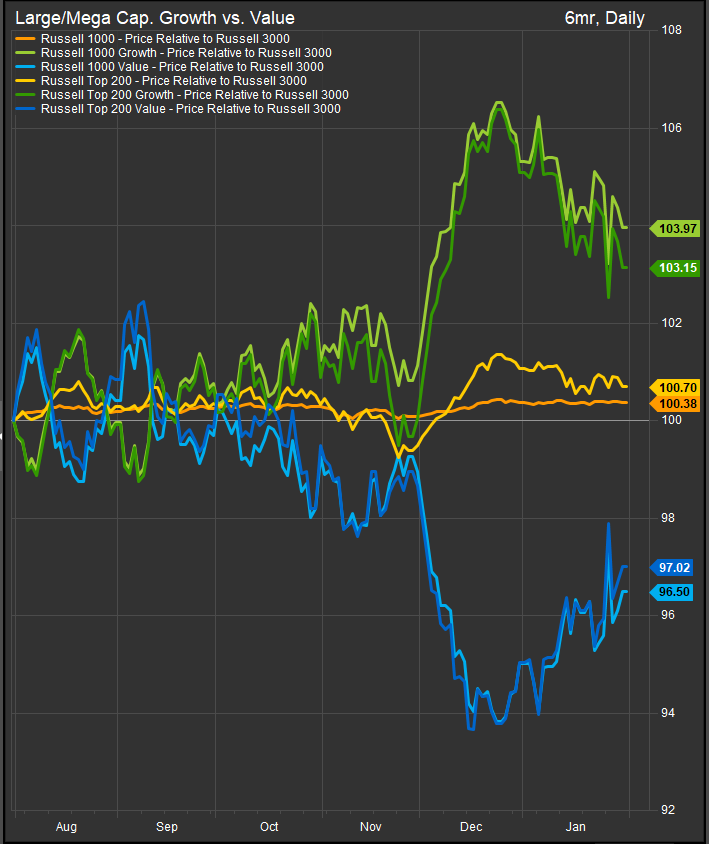
Large/Mega Cap: Value Closing the Performance Gap vs. Growth
Even as interest rates have come back towards the 4.5% level, Value continues to make gains vs. Growth in the near-term. This is likely catalyzed by Tech/AI underperformance. We may finally be seeing the hand-off from AI developers to AI users, or it could simply be a de-rating of AI developers relative to everything else.
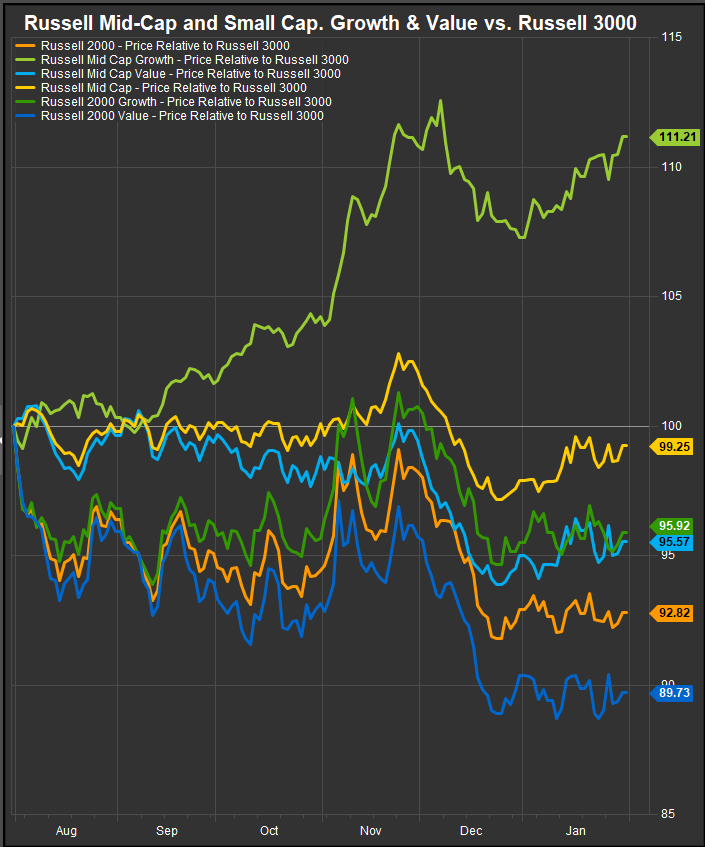
Small/Mid Stocks: Mid Cap. Growth Stands Out
Where large cap. Growth/Value Dynamics are acting as we would expect on bearish/inflationary developments, Small Cap. (R2K) stocks remain tightly correlated and Mid-Cap. Growth stocks are starting to stand out as their own dynamic. MidCap Growth is an interesting space as it doesn’t act like the Mag7/AI names that dominate the Mega Cap. Growth index. What seems to have changed in the market since November is perceptions around Mega Cap. Growth names vs. Growth in general. A headwind to Mega Cap. Growth explains what we are seeing.
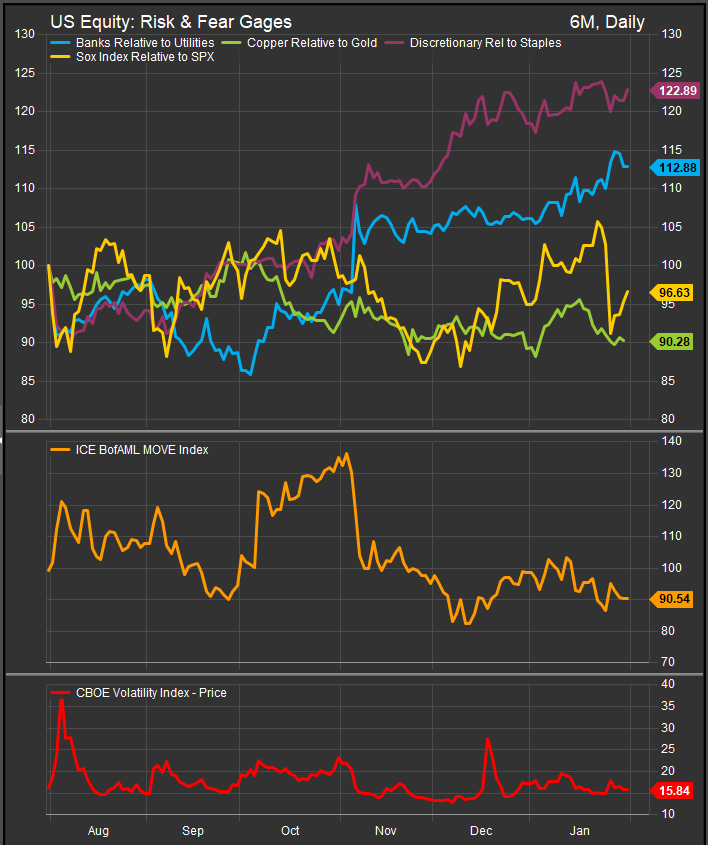
Risk On/Risk Off: Vol. Higher, Risk-Appetite Gages have been Firming
Banks have been firming relative to Utilities while Discretionary has held up well vs. Staples with rates now moving lower. Semiconductors edged to a new high and then got smacked down by the revelations around “DeepSeek”. These are conflicting signals in our process, but our chart review of the Tech and Semiconductor verticals shows deteriorating stock level technicals. We could be set up for a more serious Tech sector correction.
In Conclusion
Mega Cap. Growth, which has led the long-term bull trend since early 2023, has hit a rough patch with a confluence of stubbornly high interest rates and emerging skepticism aout the captial spending requirements of Mega Cap. US AI players. This opens the door for “everything else” to take a leadership turn. Please keep an eye out for our February sector insights posting to ETFSector.com this weekend!
Data sourced from FactSet Research Systems Inc.
