The S&P 500 rallied into the holiday and now flirts with another all-time high as investors shift attention from turkey to turkey-sandwich and the calendar begins its countdown to year end. The Factor Friday report stays vigilant, and this week we want to point out that Russell 2000 performance is perking up, and Large/Mega Cap. leadership in the cycle is at a crossroads. Leadership rotation is a healthy part of a longer-term bull trend, and small cap stocks have been out of favor since the Mag7 took off at the beginning of 2023 and established a new bull trend for equities.
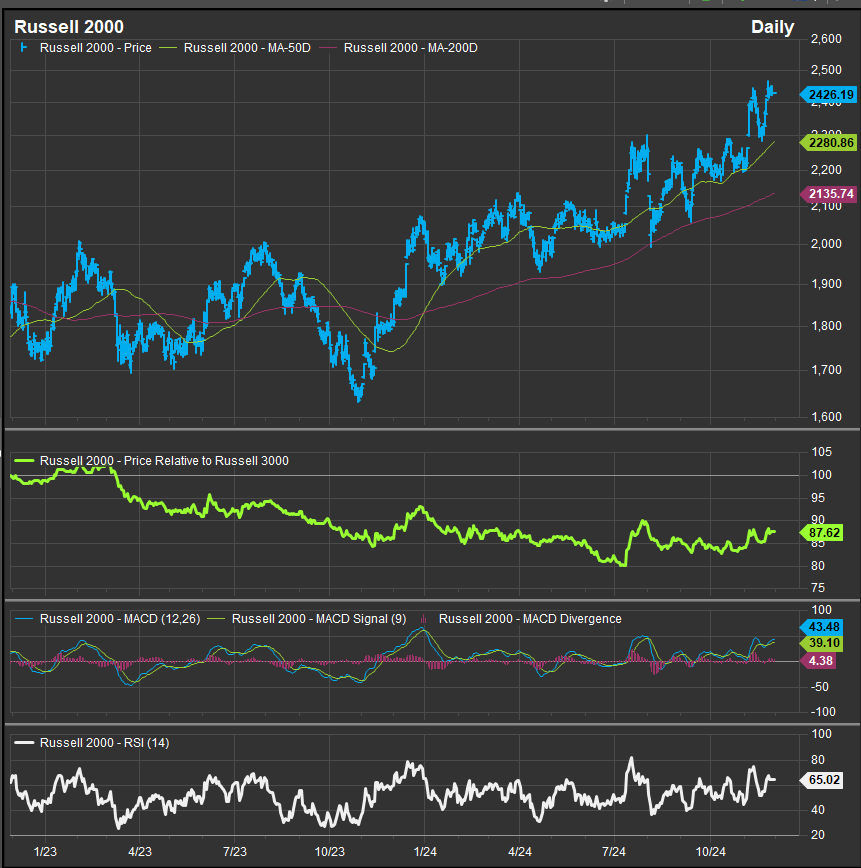
The chart below features the R2K, and the technical show the beginnings of a potentially longer-term bullish reversal. The key pivot month was August of 2024. Mega Cap. Growth had a sharp correction while Small Cap stocks broke out on high momentum with the RSI (chart, bottom panel) hitting a reading above 80 and the relative curve breaking to a higher high above 1Q2024 price action. With prices moving to sequential new highs and the relative curve turning up from a series of higher lows in September and October, the bullish reversal structure for the index is now in place. We view this in coincidence with a loss of momentum in the Large Cap. Tech sector as evidence that leadership is likely to change in a more sustainable way from the narrow tech led growth themes of 2023 and the first half of 2024.
Sectors
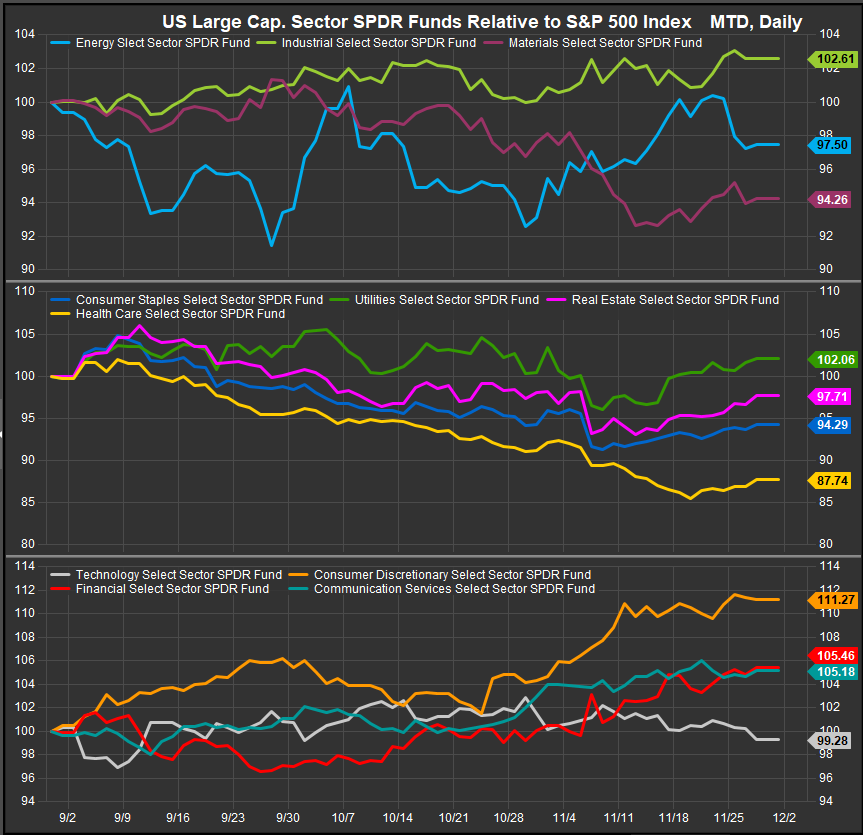
Within the S&P 500 the sector mix has favored Consumer Discretionary, Financials and Energy since the election at the beginning of November. In the very near-term, lower vol. sectors have bounced while the Tech sector has been sustainably and notably lackluster despite dovish Fed policy and some speculative exuberance from Trump’s win. We interpret this as investors becoming fatigued by the AI trade and looking for other opportunities with more unrealized potential for gains.
Large/Mega Cap: Value Performance Improving Near-term
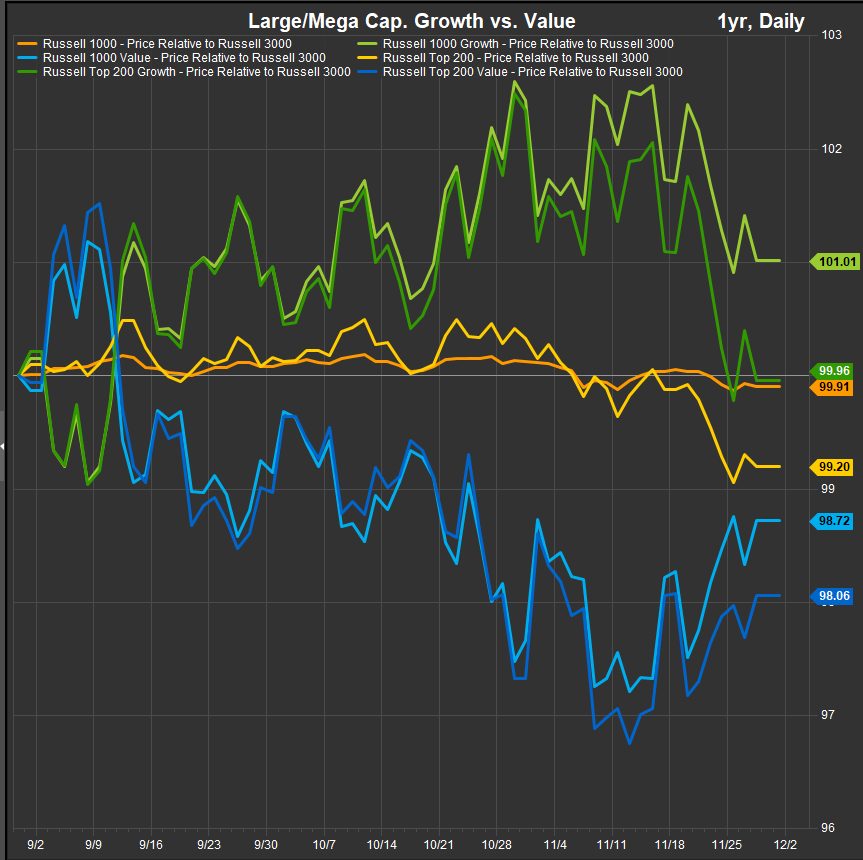
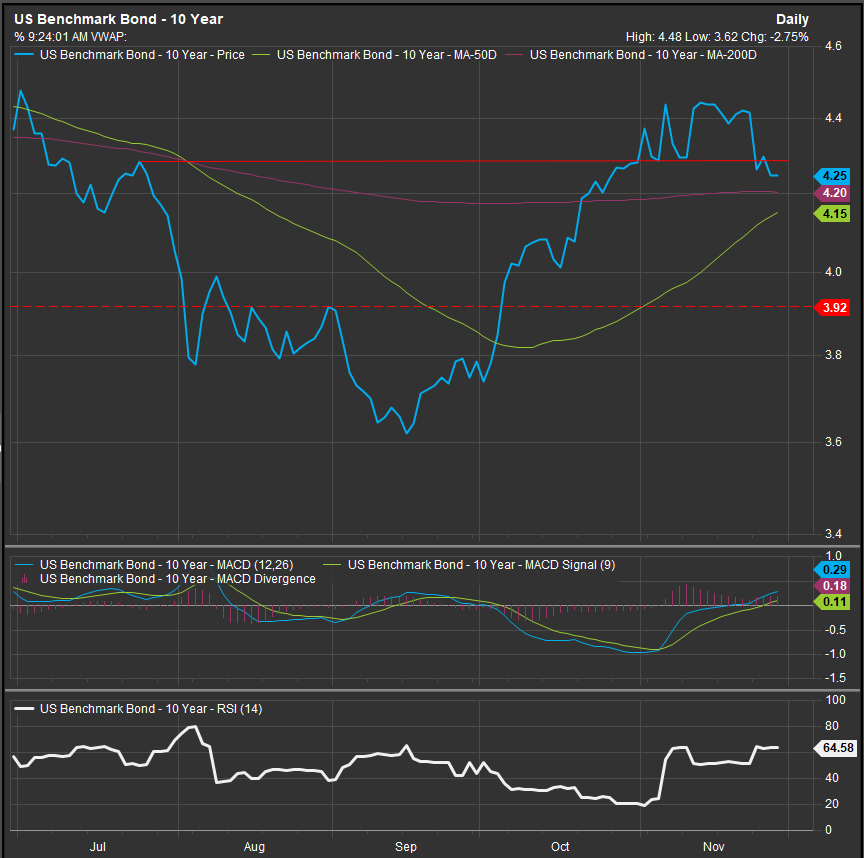
Large Cap. Value stocks continue to trace out a potential bullish reversal against Growth. Mega Cap. Growth and Mega Cap. in general have dipped to negative performance over the past 3-months which, while still inconclusive, is a necessary precursor to trend change. We think the catalyst for this rotation has been the coincident back-up in interest rates and we expect the Value factor performance to be path-dependant on interest rates moving forward. We think the 4.20% -4.30% level on the 10-yr US Treasruy Yield is a key threshold. A move lower likely spurs investors to go back to Growth, while if rates stay above, we would see more drift away from Growth themes.
Interest Rates and Interest Rate Policy: The Turkey Factor!
We think the key macro pivot for leadership themes, and potentially for the bullish trend itself, is the level of interest rates. We don’t think the consumer can make it through to a robust expansion if interest rates are sporting a 5-handle and we think it’s unlikely that Fed policy offers significant relief if the market keeps rates on a 4-handle, so the direction of rates since the Fed’s policy announcement has been our primary concnern. We think the FOMC may have made a mistake coming in aggressively with a 50-bp cut to the policy rate and if yields move higher from here, we will consider that confirmation. So, while we don’t love piling on policymakers, we think they may have been a hair to aggressive in support of an economy that is just as vulnerable to high rates as it is to recession risk. And since we think the former is the likeliest cause of the latter, we are concerned that our friends down in DC may be our most important factor (and not in a good way).
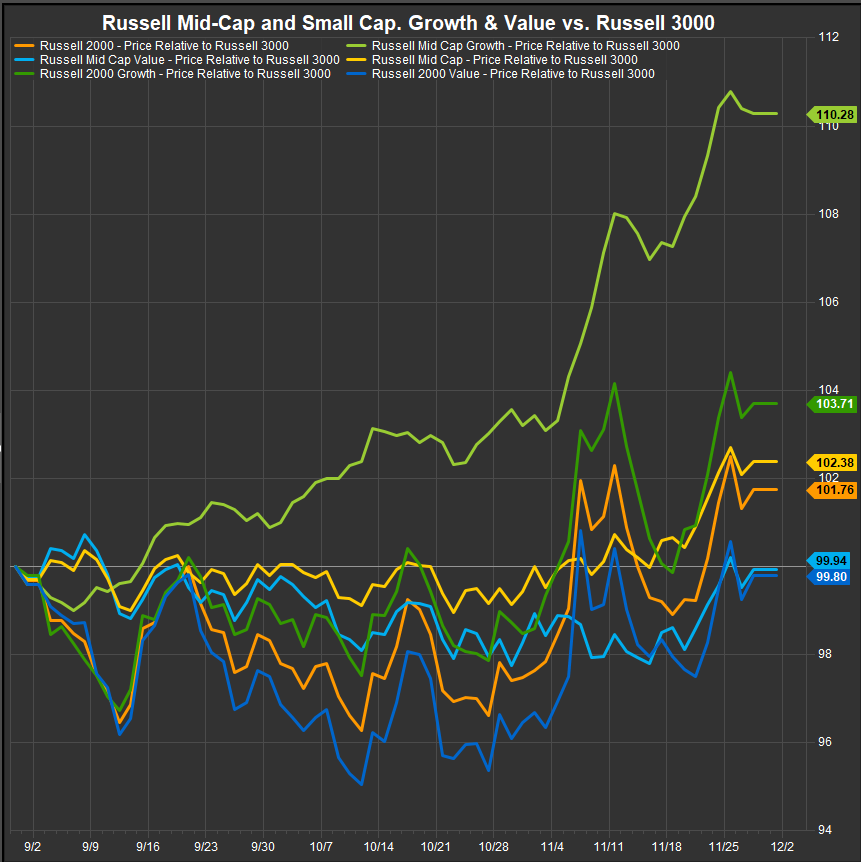
Small/Mid Stocks: Midcap Growth Surge Continues
Small/Mid Stocks in aggregate have gained in the near-term and the longer-term setup offers some “catch-up” potential vs. Mega Cap. as the latter cohort has been leadership throughout a majority of the past 2 years. The recent surge in Midcap Growth comes in the context of a multi-year underperformance trend, so a bullish reversal with strong momentum has potential for more upside follow-through here. The 4-year weekly chart below shows the context of long-term underperformance. Each style and cap-tier is positive or on the cusp of turning positive over the past 3 months relative to the broad market Russell 3000 index.
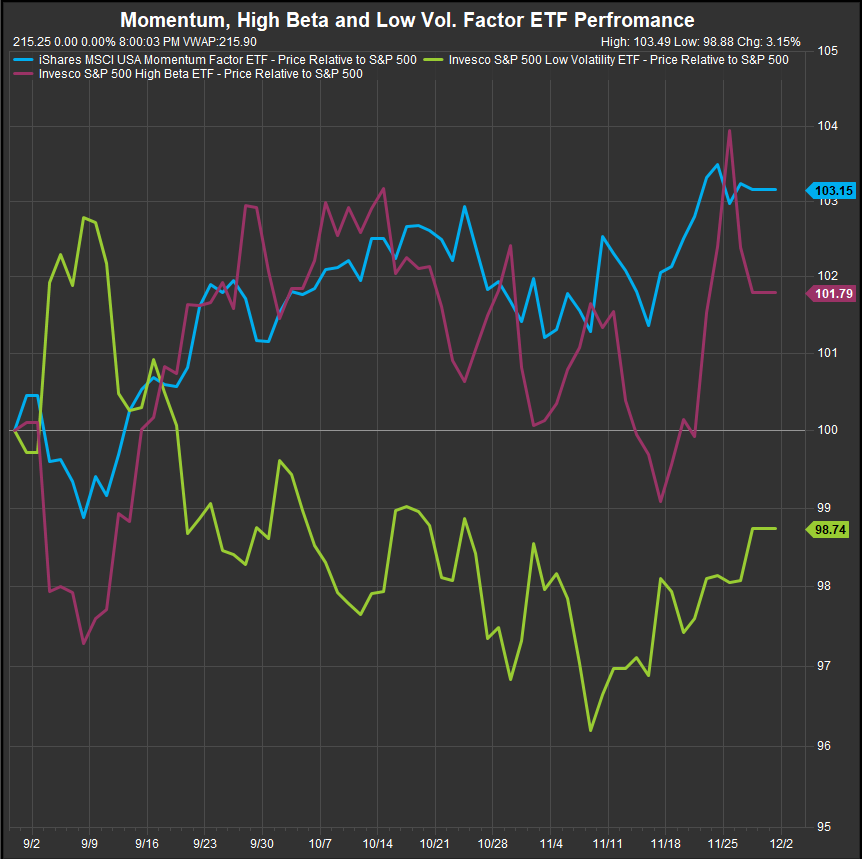
Momentum & High Beta have the Edge over Low Vol.
Momentum has maintained an edge despite the Tech Sector stalling out since July. High beta stocks have rallied in the past week as Discretionary and Energy Sector shares have outperformed.
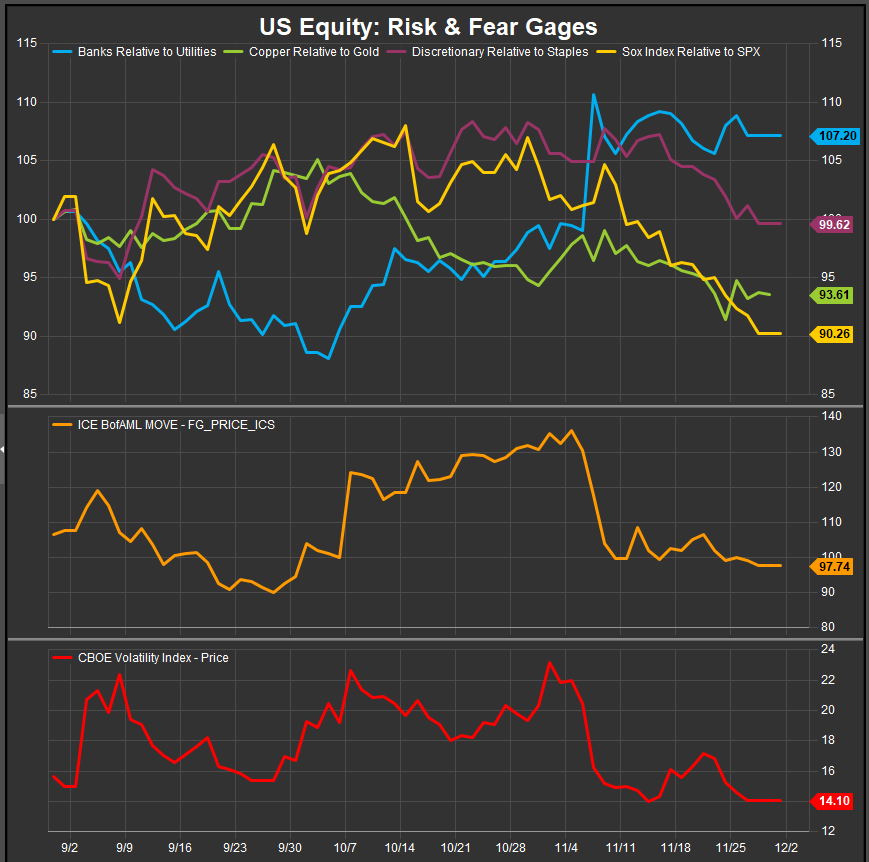
Risk On/Risk Off: Vol. Remains Low, but Investors have paused their Accumulation of Riskier Assets
The VIX and MOVE Indices, representing volatility in the equity and fixed income markets respectively, are both at lows of the past 3-months. It is important to note that these gages represent only the vol. that is “priced in” by the options market. Given the back-up in interest rates, there’s potential that investors have become complacent. Exogenous shocks whether from Tariff/Trade-war developments or the multiple combat zones in Eastern Europe and the Middle East could yet be a factor in price action. However, we think the biggest issue is rising rates which occlude the path to a recovery in consumer balance sheets and purchasing power. The consumer needs relief from cost pressures and rate pressures.
In Conclusion
Equity leadership has been fleeting since July, but the upward pressure has come off Commodities prices while rates have pushed higher regardless. We are seeing a loss of momentum in the Technology Sector and a corresponding near-term sluggishness in Growth shares vs. Value. Interest rates will likely determine the course of style leadership from here. If they remain elevated, we could see Value and Min Vol. factors taking over leadership from Growth into 2025. If prices and performance continue on their current trajectory, we project to move to an underweight position in the Tech Sector for December as momentum and breadth have narrowed there.
Data sourced from FactSet Research Systems Inc.

