
Throughout 2024 we have highlighted fundamental and style factors that have been thematic drivers of sector rotation. Since the current bull market’s inception in 2023, Meg Cap. Growth has been the dominant leadership cohort along with the momentum factor. Corrections in the market have typically benefitted a broad range of other factors and styles, while moves to new highs are typically driven by Mega Cap. Growth. With the S&P 500 making new all-time highs in September, let’s take a look at these performance trends and see if anything has changed from a factor leadership perspective.
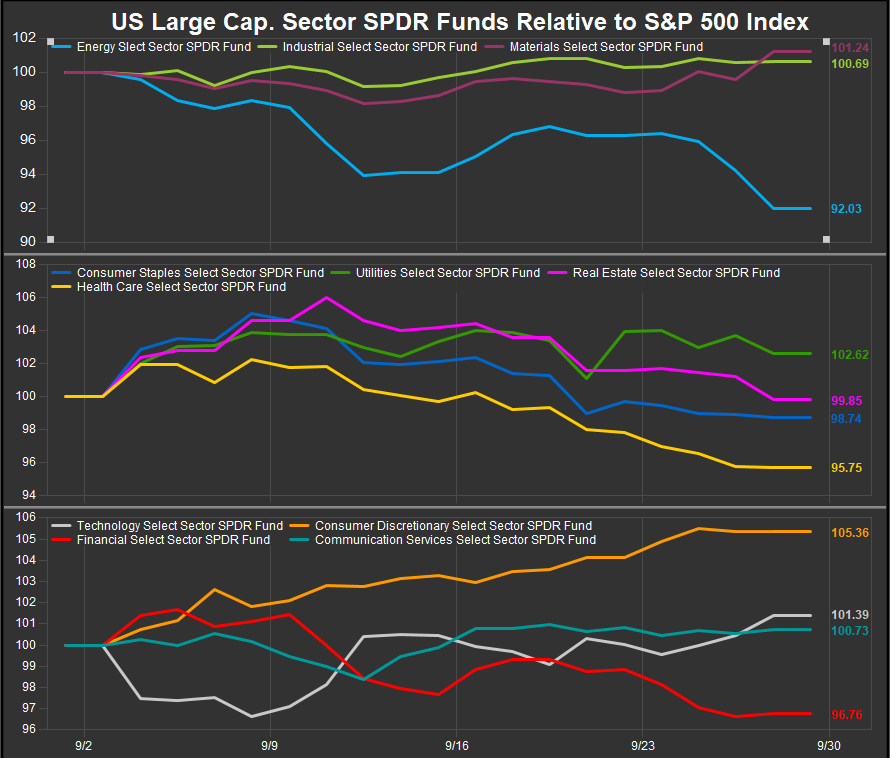
Let’s recap some month to date sector performance. We’ve seen market consensus firm around a Fed easing cycle in the 2nd half of the year, and the Fed seemed to double down on that by starting with a 50bp cut to the target rate and guidance of another 50 bps in cuts by year end. The market discounted this by buy longer dated bonds, lowering yields ahead of the Fed as well as lower vol. sectors and sector funds like XLP, XLU, XLRE and XLV. However, the chart below shows month-to-date relative performance for September, and we can see defensive sector performance (panel 2) rolling over since the beginning of the month with XLY and XLK beginning to outperform. XLF has been an outlier vs. historical expectations but has been positively correlated to lower vol. sectors over the near-term. That is something to watch moving forward.
Commodities linked sectors (chart, top panel) have seen the XLE fund performance diverge negatively while XLI and XLB have firmed up in the near-term. We continue to have a negative view on the Energy sector and a more neutral view on Materials and Industrials at this time.
Large/Mega Cap. Growth Still Upside Leadership
Looking at Large and Mega-Cap. Growth vs. Value in the chart below, we can see Mega Cap. Growth and Value as proxied by the Russell Top 200 Growth and Value Indices have pivoted from narrowing their trailing 12-month performance spread to widening it back out again. As we alluded to at the top of the piece, higher equity prices broadly have coincided with Mega Cap. Growth leadership specifically and Growth leadership more broadly. That dynamic hasn’t changed. We would look to commodities prices to give us a potential signal on this. At present they are rallying in the near-term but remain firmly in a downtrend.

Small/Mid Stocks still trade together
In contrast to the Large/Mega Cap. space, the Small/Mid tiers of the US equity market continue to trade together. The Russell Mid-Cap. Growth index is showing some signs of life over the past week as Tech. shares have received a bid on the revival of AI optimism after some strong earnings releases and OpenAI starting the potential push to go public. We have mentioned in the past that we think the split in large vs. small has more to do with the Mag7 stocks than any broader equal weighted vs. cap. weighted dynamic. Our opinion on that remains unchanged at present.

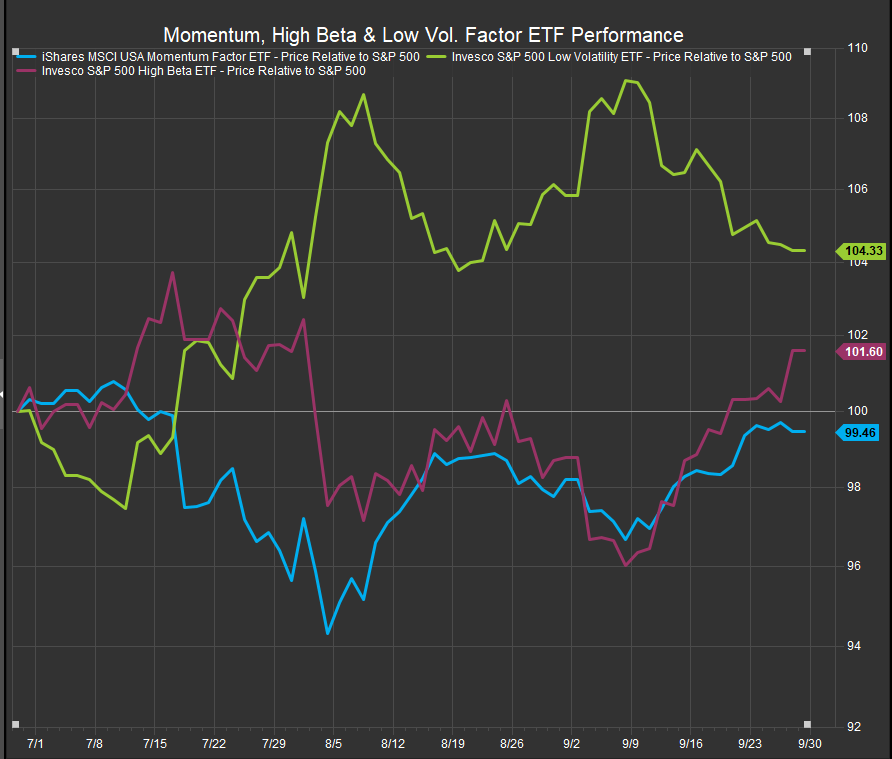
Momentum and High Beta coming back to life
Reviewing our key factor ETF’s, we see low vol. relative performance peaking in early September and giving way to high beta. Momentum has also improved but hasn’t made a new 3-month high. We are looking for that to confirm the market’s renewed enthusiasm for Tech and Growth stocks. We will continue to favor this as the likely outcome unless we see signals from Commodities prices or Value style benchmarks. Our signals are typically triggered by new absolute and relative price highs or lows over 3m, 6m or 12m timeframes. The iShares MTUM ETF moving above its 7/10 highs would be a confirming signal for Growth leadership in our work.
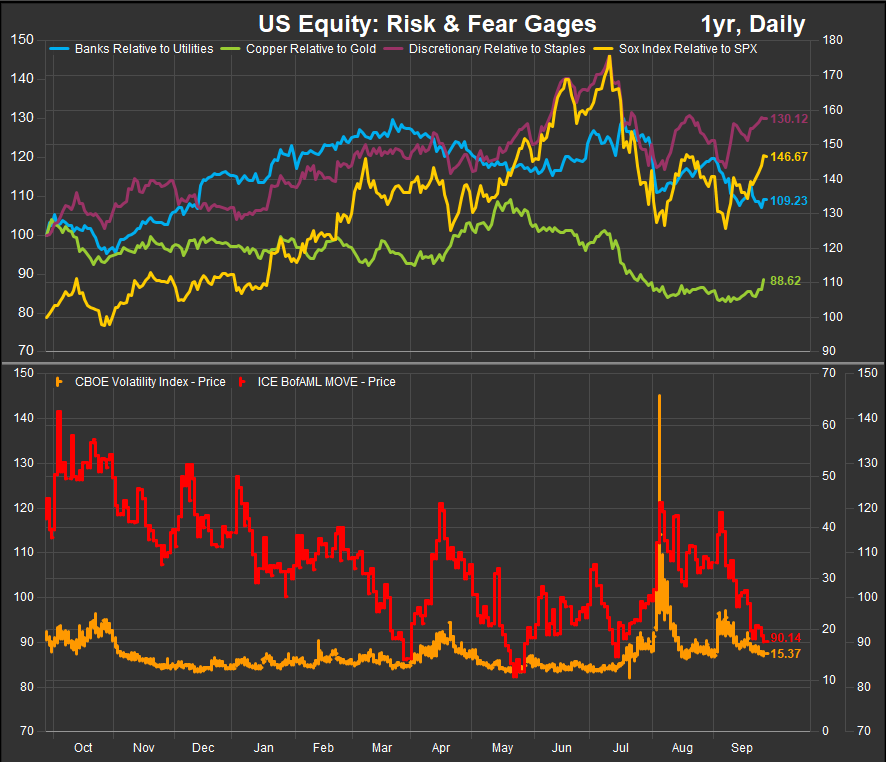
Risk On/Risk Off proxies have switched to favoring Risk On
As August’s volatility dissipates investors are taking a more sanguine view of the outlook for equities. We can see some of our risk on ratios reverse gradually to the upside. The most recent to show signs of life is the Copper/Gold ratio. Discretionary vs. Staples and Semiconductors vs. the S&P500 are also showing improvement supporting the idea that investors are increasing their risk appetite as volatility diminishes (chart, bottom panel, VIX/MOVE indices).
In Conclusion
Factor performance confirms investors are starting to add risk again with the Fed coming in to support stocks and pertinent economic and company fundamental data supporting an optimistic outlook. With the presidential election less than 40 business days away there is potential for some volatility, but what we are seeing at present is constructive and bullish. Our Elev8 portfolio model is long XLY, XLK, XLF, XLC and XLI based on our current read of the macro and technical backdrop for equities.
Data sourced from FactSet Data Systems
