July 11, 2025
Interesting things are happening now that the S&P 500 is out to new all time highs having put the global trade war correction in the rearview mirror. The bull trend that began in early 2023 lives again, but we are seeing changes in the leadership profile of the US equity market from a thematic and factor perspective. We dive into the latter dynamics in today’s column.
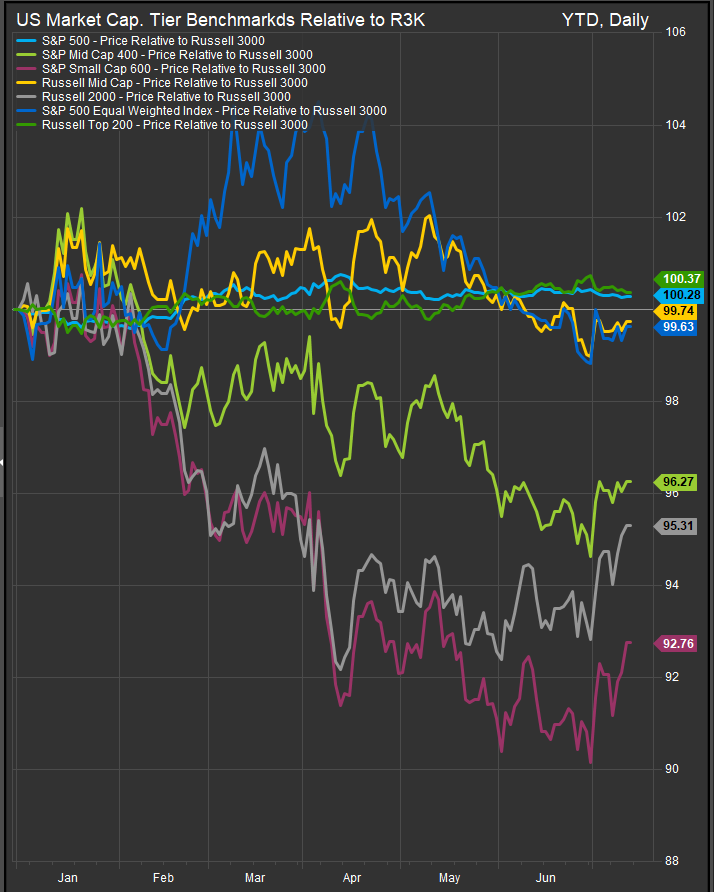
Small Cap. Gaining…
Looking at YTD performance of various market cap. tier benchmarks we can see the S&P 500’s break-out has coincided with a burst of buyer interest in Small and MidCap stocks. The further down cap. one looks, the better the performance. The performance of small cap. stocks in the very near-term has already eclipsed the slight edge they offered during the February-April correction, and we’re interpreting this enthusiasm as a firming of investor risk appetite.
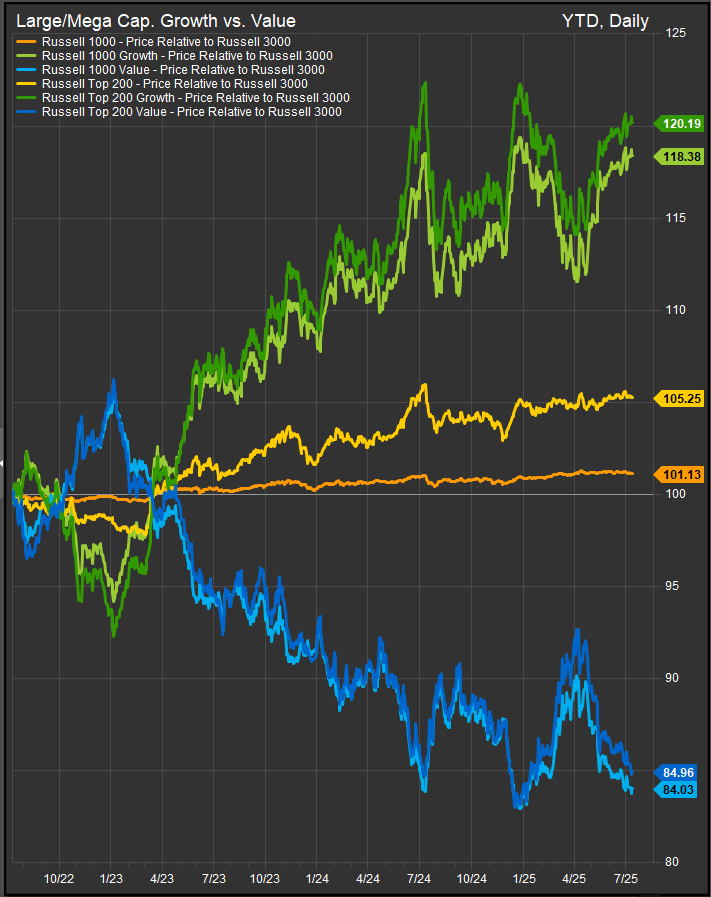
Large Cap. Growth vs. Value
These factors have performed with an extreme negative correlation within the universe of domestic large cap. stocks over the long-term (chart below). We can see that the earlier portion of the bull run in 2023 were dominated by Growth stocks, but the past 12 months of the cycle have seen intermediate-term mean-reversion between the two styles.
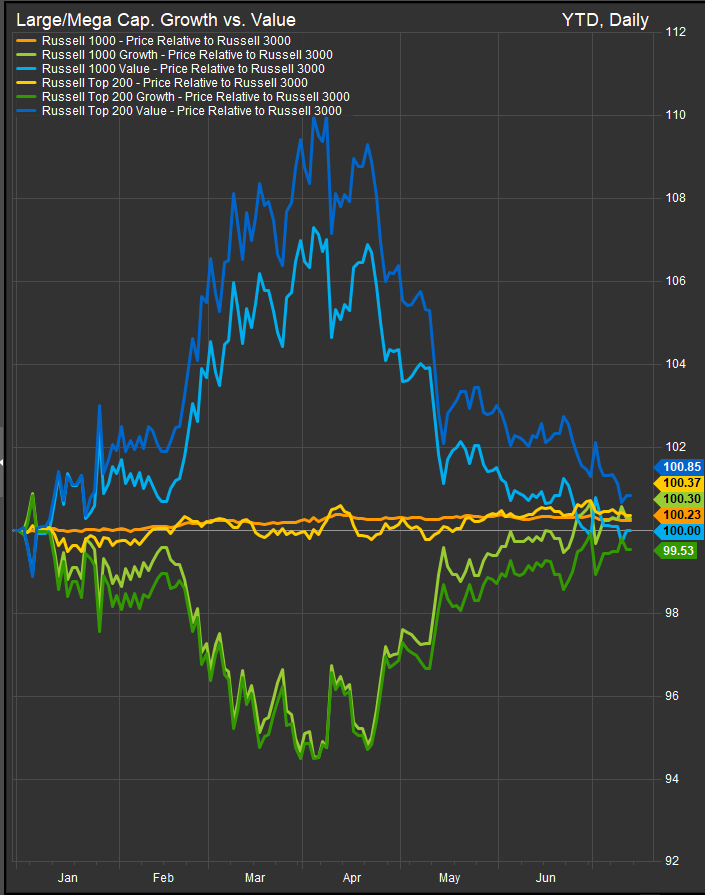
Looking at the same chart YTD (below), we can see the relationship is at a potential pivot now that Value stocks have fully round-tripped on their previous outperformance.
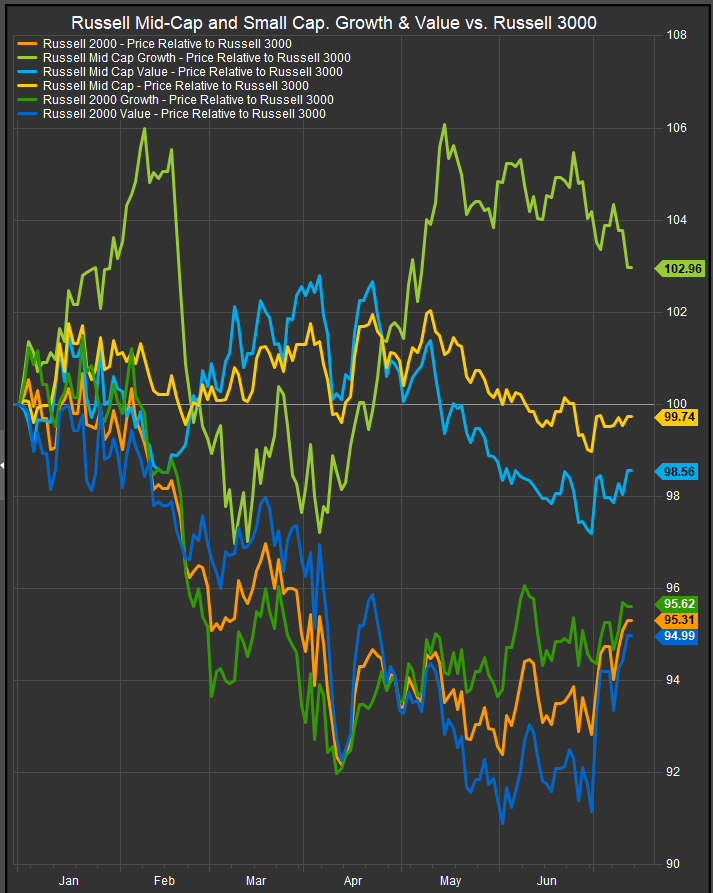
Small/Mid Growth vs. Value
Within the Small/Mid universe, the smaller stocks is preferred in the near-term as R2K style benchmarks for both Growth and Value have led since the calendar flipped to July (chart below).
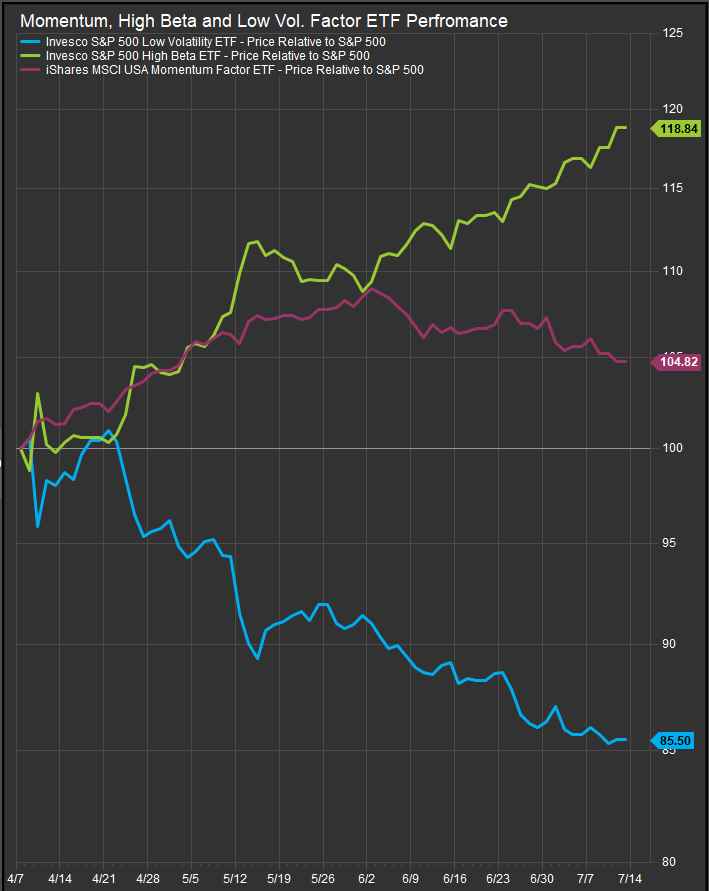
Big Spread between High Beta and Low Vol. off the Lows
The chart below shows high beta, low vol. and momentum proxy ETFs off the April 7, 2025 lows for the S&P 500. What’s interesting to us is how high beta is being preferred in the last month over momentum. We think this is a sign that investors are moving on from anchoring their portfolios around mega-cap. Growth names.
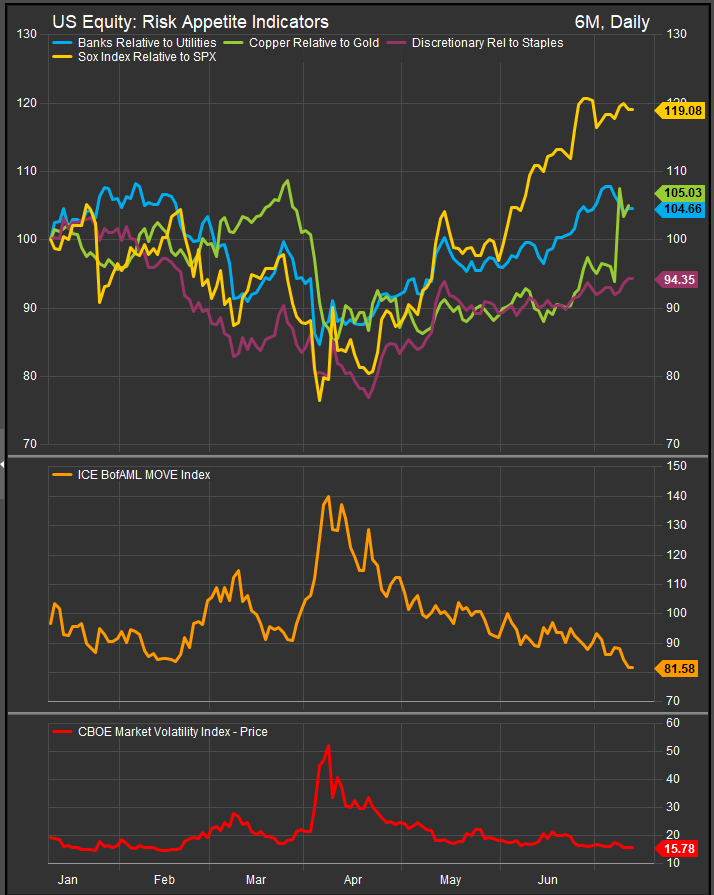
Risk on/Risk off
Our risk appetite proxies have remained firm throughout the equity advance. Coincidentally, the VIX and MOVE volatility indices for stocks and bonds respectively have moved near 6-month lows and are nearing levels that have marked “complacency” in the past. While we think this is likely to set up a consolidation during the weak seasonal period of August-October, at present there is some potential for “FOMO” as the equity uptrend is now obvious.
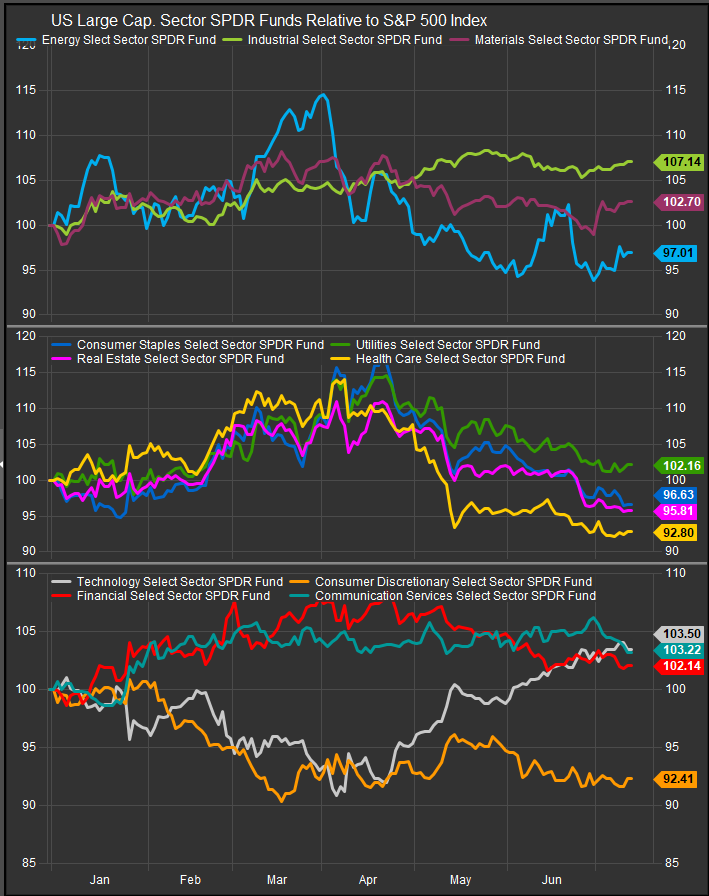
Sectors
At the sector level, the shift to higher beta has benefitted commodities related sectors (chart below, top panel), while low vol. continues to trade lower vs. the S&P 500. Technology shares have been clear leadership off the April low while our other historical bull market exposures, Financials and Discretionary, have been slowly giving up ground since May.
Conclusion
Investor risk appetite continues to firm, and we are seeing some rotation into smaller stocks that we attribute to bets on tariff policy outcomes, USD weakness and bets on the Fed taking rates lower as inflation proxies remain tepid. The prior bull trend was a Mega Cap. led affair and the breadth profile for the US equity market has been narrow compared to previous bullish expansions. We could be seeing a broadening out stock level participation. The downside potential remains with inflationary scenarios as weak USD and tariff imposition are both potentially inflationary developments. If we see longer-term yields and commodities prices climbing above previous highs we would be concerned, but that’s not where we are at present.
