

S&P 500: Market Internals
The S&P 500 rallied to marginal new all-time highs in January and start February consolidating near those highs. Below is our S&P 500 Market Internals chart which tracks the strength of the uptrend at the stock level. That chart is setting up a negative divergence at present. The middle panel shows the % of S&P 500 constituents above their respective 50-day and 200-day moving averages. Those series have reflated to >50% from lows near 10%. However, with the series consolidating below the 60% level, the S&P 500 is exhibiting weaker internals than it did at highs in December and October. This is a negative breadth divergence setup at present. We want to see our stock level trend proxies perk up and reconfirm the bull by hooking higher here which would show that the environment for equities is still positive for the average stock.

Rates Move Lower, Despite Commodities Higher
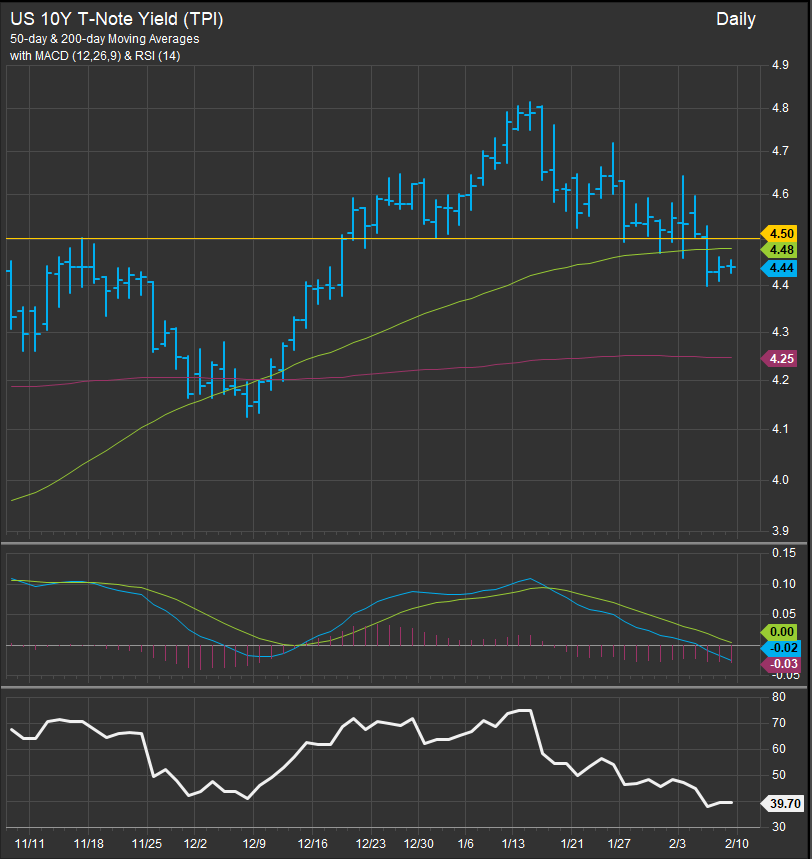
After 2025 started with a bout of inflation agita, the US 10yr Yield has now moved below near-term support at the 4.5% level and are near-term oversold. Per the chart below, the MACD oscillator is still on a sell signal which has expecting that Yields will stay below 4.5% for at least the near-term.
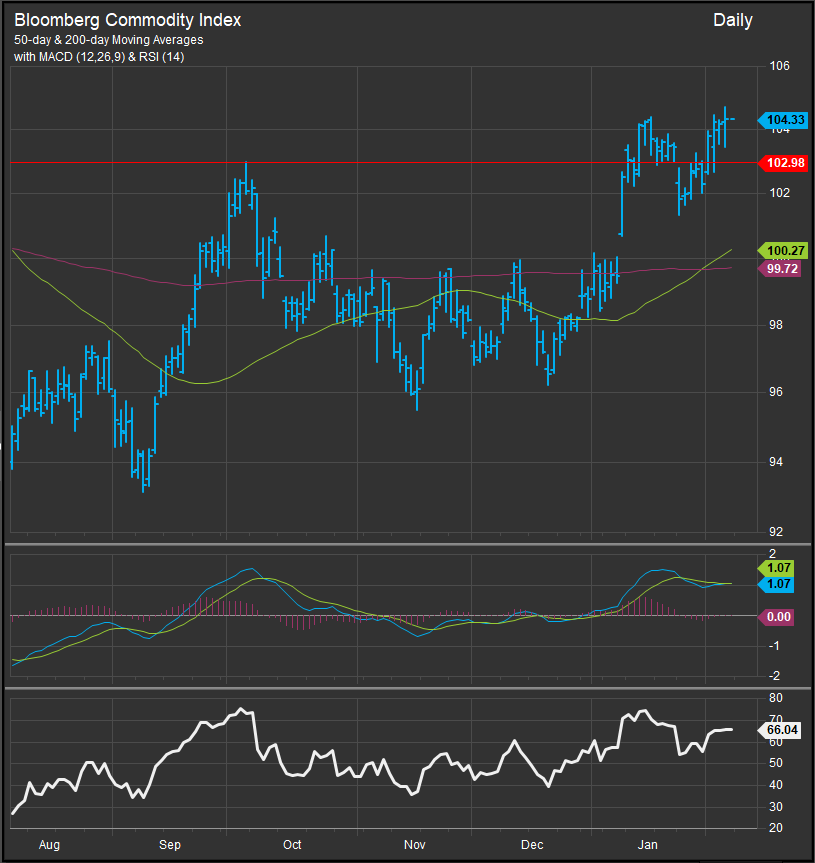
What’s a drop surprising about the rate picture is rates have moved lower as Commodities prices have firmed in the near-term. Typically, this is a tension between the two series that needs to be resolved. The chart of the Bloomberg Commodities Index hit 6-month highs intra-day yesterday.
Sectors: Technology Sector Starting to Look Vulnerable
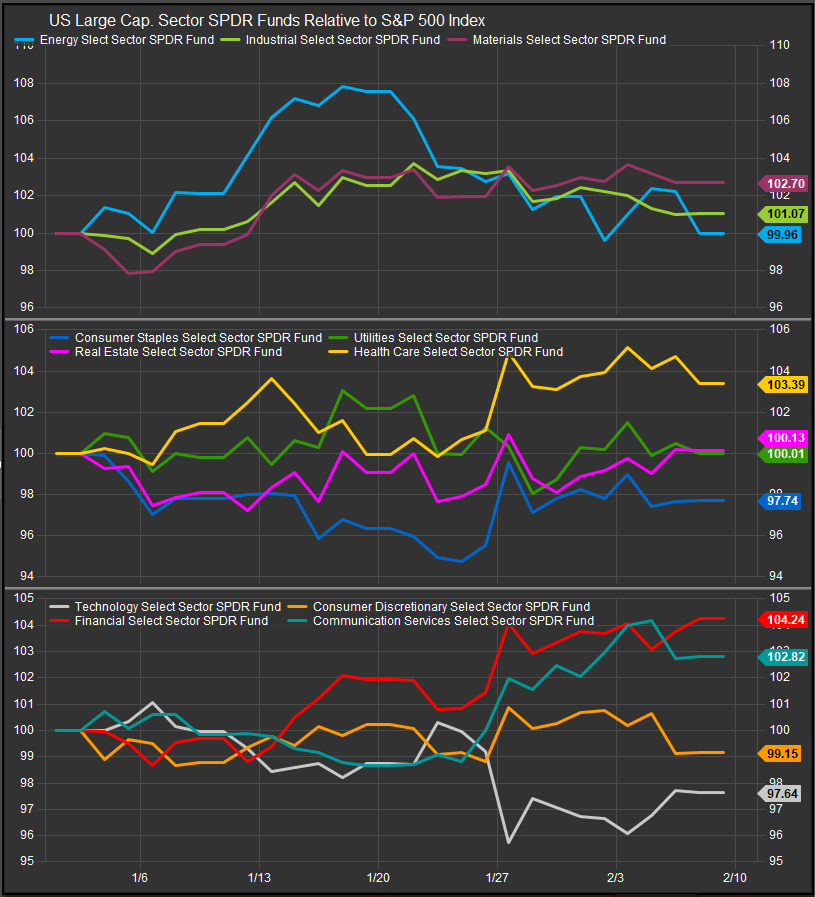
Sector performance YTD shows a mixed picture across each of our three broad sector categories. Commodities sectors (top panel) started fast but faded into February. Defensive sectors have generally been market performers with Healthcare the strongest in 2025. Financials have been leadership so far. The Technology sector has continued to see lackluster near-term performance. AI as a theme still seems to have plenty of positive sentiment around it, but the big AI “halo effect” has receded. The average S&P 500 Semiconductor stock is now sell rated in our work while NVDA and AVGO seem to be the main supports to the SOX Index.
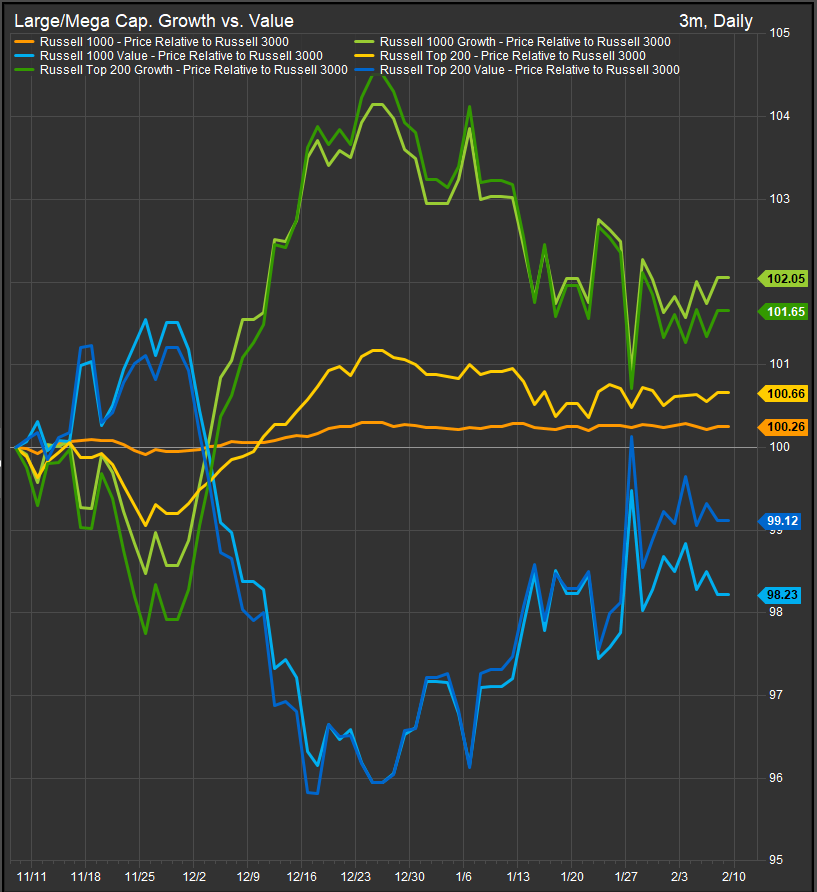
Large/Mega Cap: Value Closing the Performance Gap vs. Growth
Growth/Value made a bid for parrity on January 28 and now consolidate with the performance gap between the two styles as narrow as its been since November. As usual in this cycle NVDA earnings are set up to be a potential pivot when they report on 2/26.
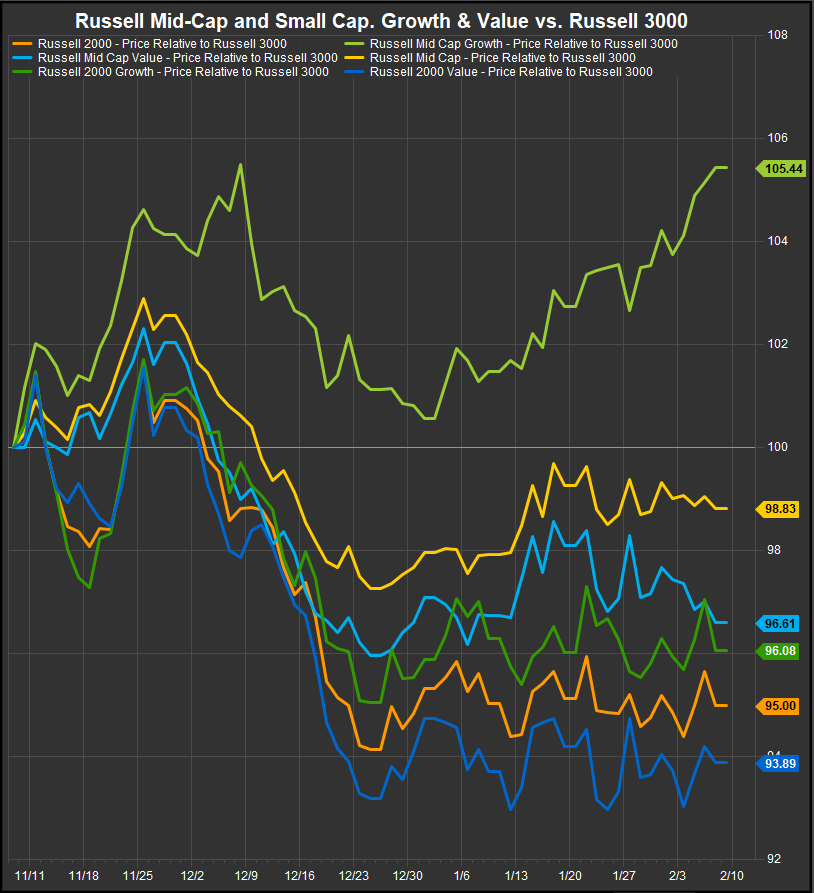
Small/Mid Stocks: Mid Cap. Growth Stands Out
Small Cap. (R2K) stocks remain tightly correlated and Mid-Cap. Growth stocks are starting to stand out as their own dynamic. MidCap Growth is an interesting space as it doesn’t act like the Mag7/AI names that dominate the Mega Cap. Growth index. What seems to have changed in the market since November is perceptions around Mega Cap. Growth names vs. Growth in general. A headwind to Mega Cap. Growth explains what we are seeing.
Momentum Factor has Broken out to the Upside
The chart below shows Invesco High Beta and Low Vol. ETFs along with the MSCI Momentum ETF (MTUM). MTUM performance has stood out MTD. Notably the tails of the volatility curve are underperforming while momentum thrives.
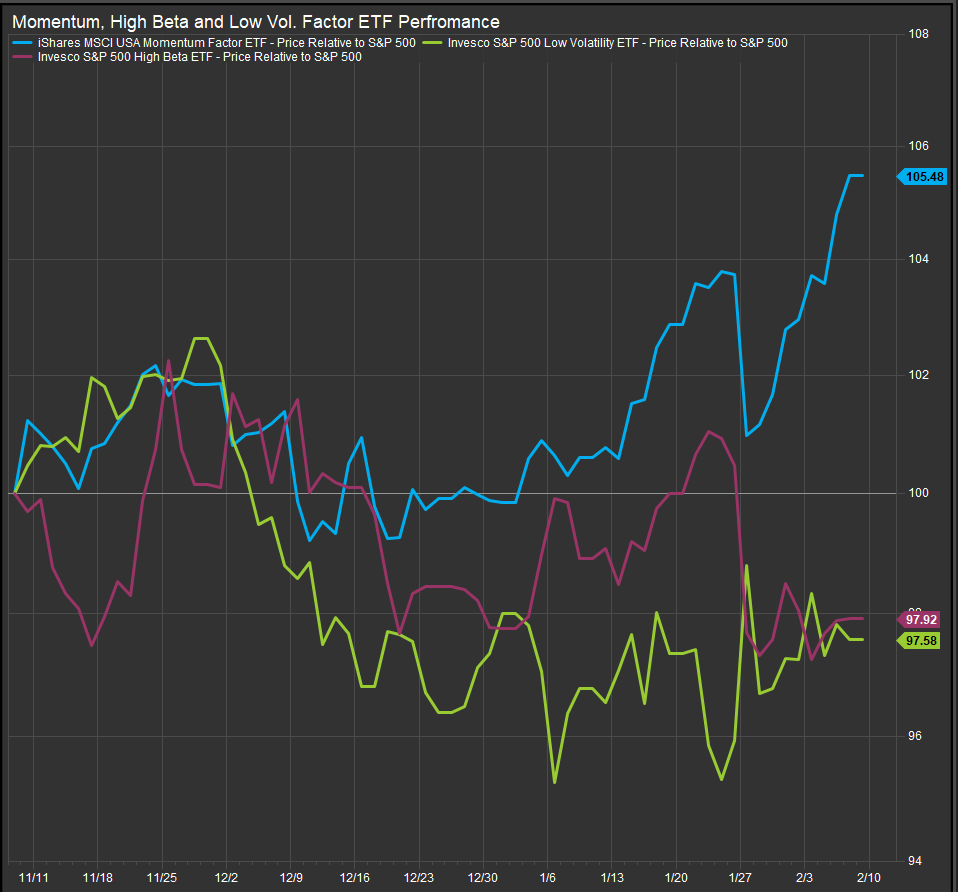
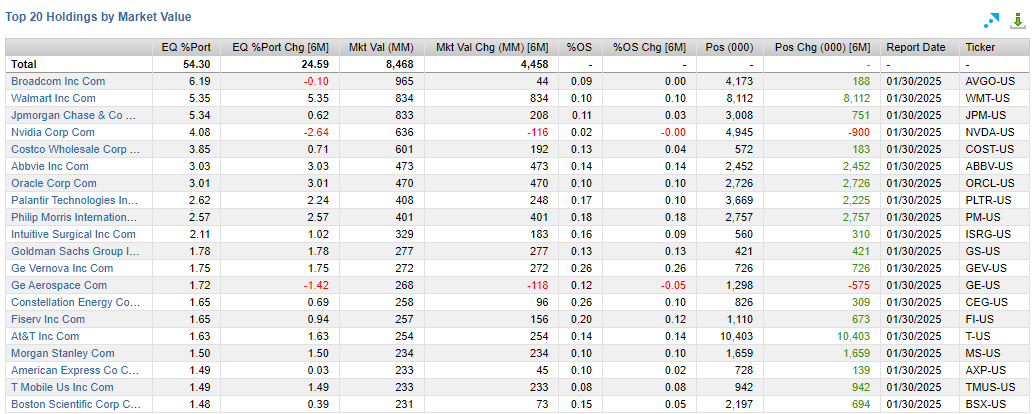
A look at MTUM’s top 20 holdings shows the nature of Momentum investing has changed since 2023 when the fund was dominated by Mag7 and Semiconductor names. Still some big Tech in there (AVGO, NVDA, PLTR, ORCL), but COST, WMT, JPM, GE and AT&T??? PM??? This is not frothy concept stock momentum. This is a mature bull market looking for something else to get excited about.
Risk On/Risk Off: Vol. Higher, Risk-Appetite Gages have been Firming
The SOX Index is rallying after what looked like a break-down in late January. Copper is hooking higher relative to gold, but both those relationships have been basically flat to down over the past 3 months. Banks have been unambiguously preferred over Utilities while Discretionary stocks have been strong vs. Staples since November.

In Conclusion
The Bull market trend has matured and Investor enthusiasm for AI seems to have transitioned from an exuberant phase to a more sober one. We wouldn’t say the bull trend is on the ropes, but it is in need of a catalyst here. Financials have been leadership in the new year and momentum is no longer synonymous with Mag7.
Data sourced from FactSet Research Systems Inc.
