
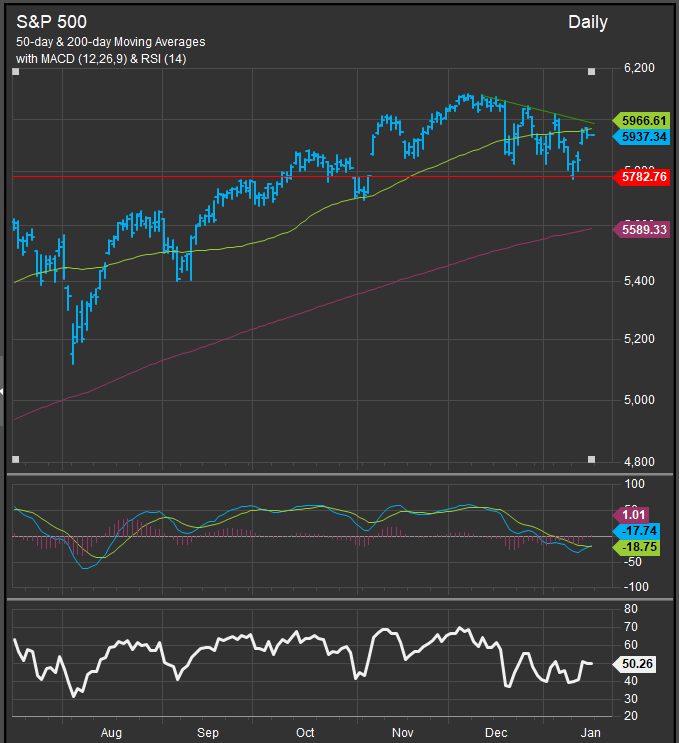
The buyer has shown up at our support level, but the S&P 500 remains in a consolidation as we close out the week. We review factor performance to get a read on investor positioning after recent data releases have muddied the inflation picture again.
Macro
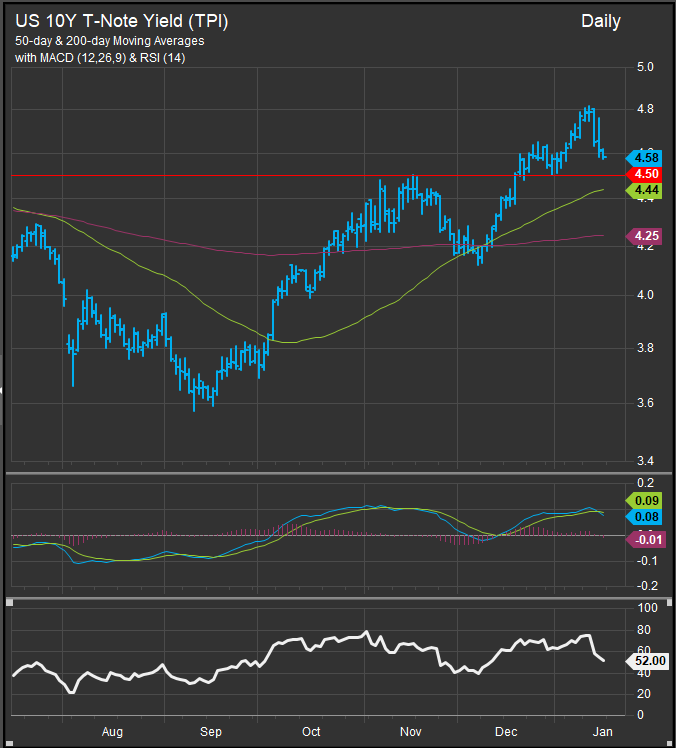
Equities have rallied since last week’s market tiff over inflation. Interest rates broke out to multi-year highs as measured by the 10yr Yield but have come back in on softer CPI/PPI readings and some dovish comments from Fed Governor Waller this morning. However, uncertainty over the path of inflation remains as hotter economic prints foreground the concern with policy makers clearly taking a “wait and see” approach to potential rate cuts.
We look to price behavior to give us an edge on these weighty matters. The S&P 500 has consolidated over the past month (chart below) and needs to close above the 6000 level to give us a bullish “tell”.
Rates Pulling Back after their Break-out
A clear upside break-out on the 10yr Yield (chart below) had us paring risk and Growth exposure last week. We still think some caution is warranted, especially regarding Growth exposure in the near-term. The 10yr Yield (chart below) would need to move below 4.5% to call its upside move and the longer-term upside reversal pattern into doubt. Above 4.5% we maintain expectations of an upward bias for rates and a headwind to Growth exposures.
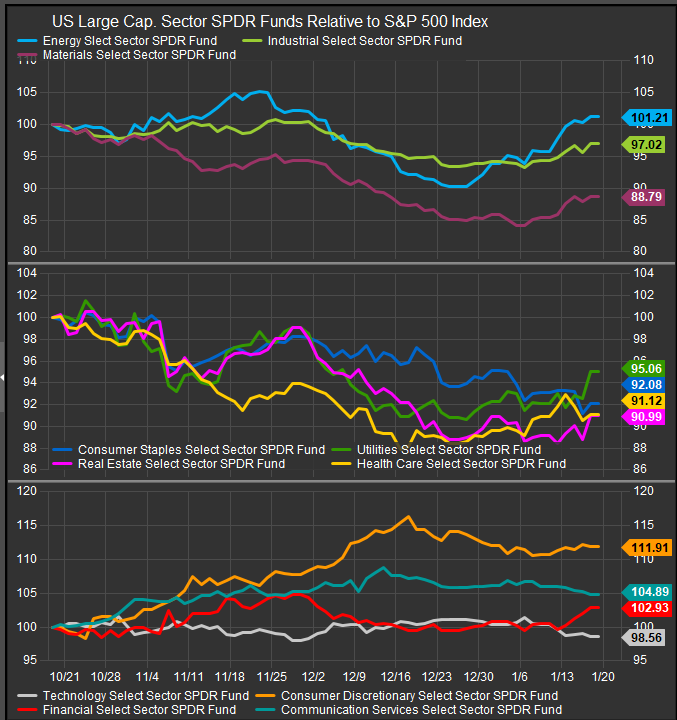
Sector Performance is in Rotation near-term
Large Cap. GICS Sector performance (chart below) has shown rotation into more Value focused areas of the equity market as Utilities, Energy, Materials and Financials stocks have perked up in the last two weeks. Rotation has come at the expense of Technology, Comm. Services, Staples and Discretionary though the latter has firmed in the near-term with equity prices.
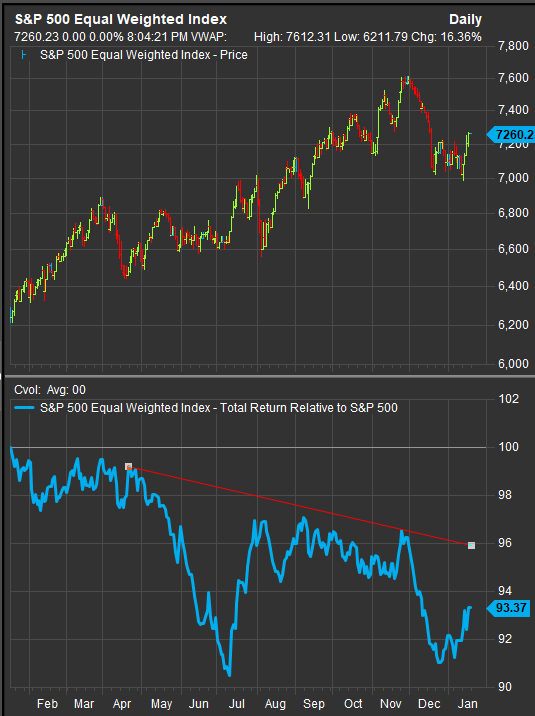
Smaller co.’s are Outperforming Mega Cap.’s in S&P 500
The Equal weighted S&P 500 Index outperforming its Cap. weighted counterpart (chart below). This performance dynamic was pronounced during the July/August 2024 sell-off and we interpret it as a sign that Mag7-led Growth leadership remains on the ropes.
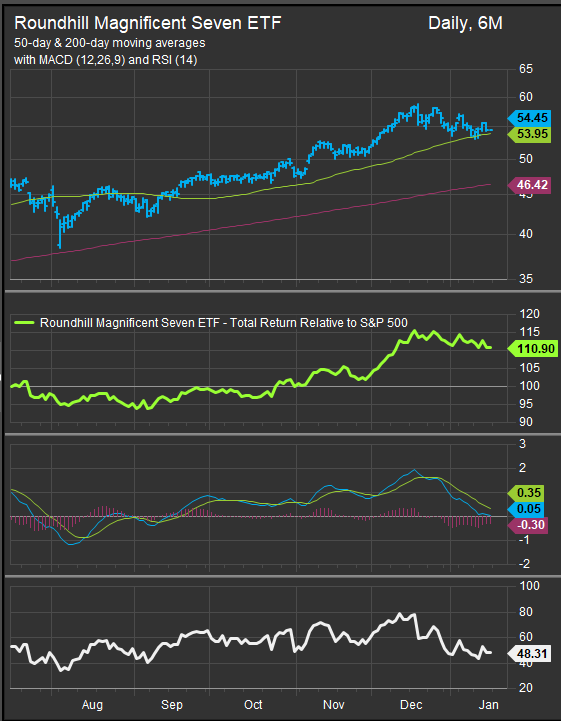
Mag7 performance as proxied by the Roundhill Magnificent Seven ETF (MAGS) continues to retrace gains from December. We think a little too much good news was priced in here and likely still needs to be worked off. Looking at the MAGS chart (below), price has support at the $50 level while currently trading above $54.
Large/Mega Cap: Value Continues Close the Performance Gap vs. Growth
Despite rates pulling back, we are seeing a continued investor preference for Value in the near-term vs. Growth.

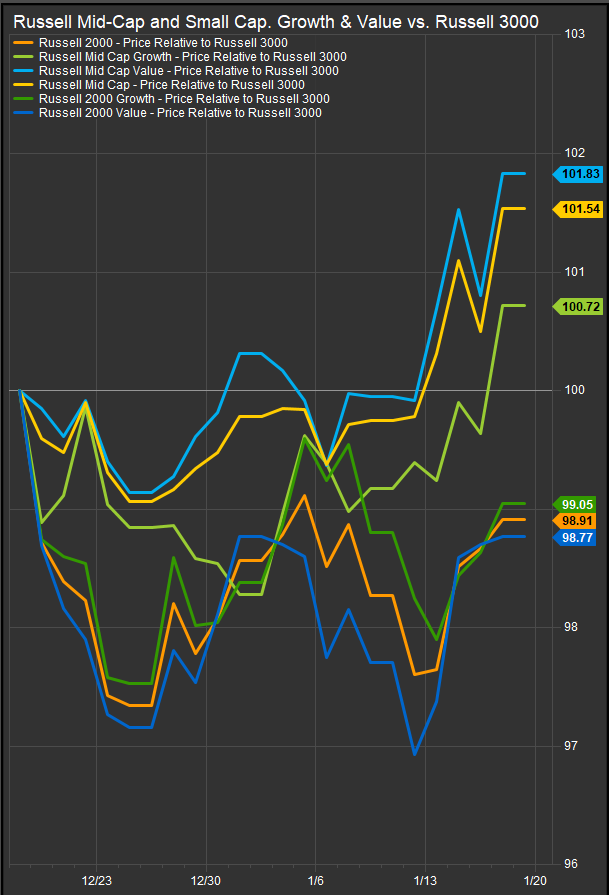
Small/Mid Stocks: Small Cap. Diverging Negatively from Mid
Over the past month Mid-Cap. stocks regardless of style have outperformed Small Caps. The middle of the cap. tier is where investors are going as Mega Cap. Growth corrects and risk appetite contracts due to re-emergence of inflation risk.
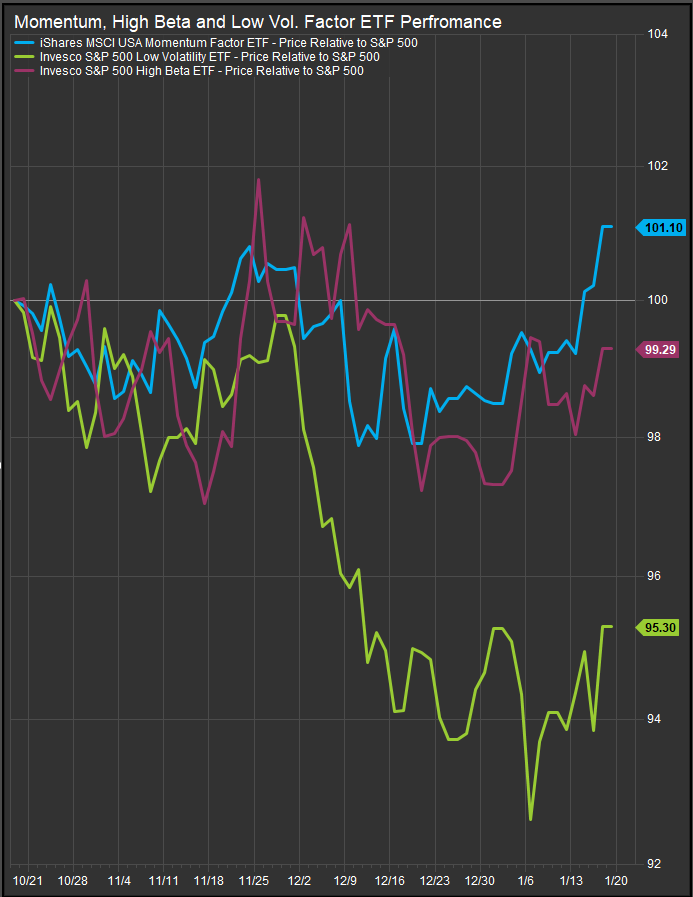
High Beta & Low Vol. ticking higher
The chart below shows iShares Momentum Factor ETF (MTUM) and Invesco High Beta and Low Vol. ETF’s (SPHB, SPLV). This is a rare period where each fund is moving higher over the past two weeks. Our read is that when Mag7/Mega Cap. Growth stocks correct, money flows to the 8 GICS sectors that don’t have mega cap. cornerstone companies. Low vol. stocks historically are Utilities, legacy Telecom, Staples and Healthcare co.’s. Highest beta stocks typically reside in the Energy and Materials sector, so a move away from big Tech and big Growth benefits volatility factors of all stripes.
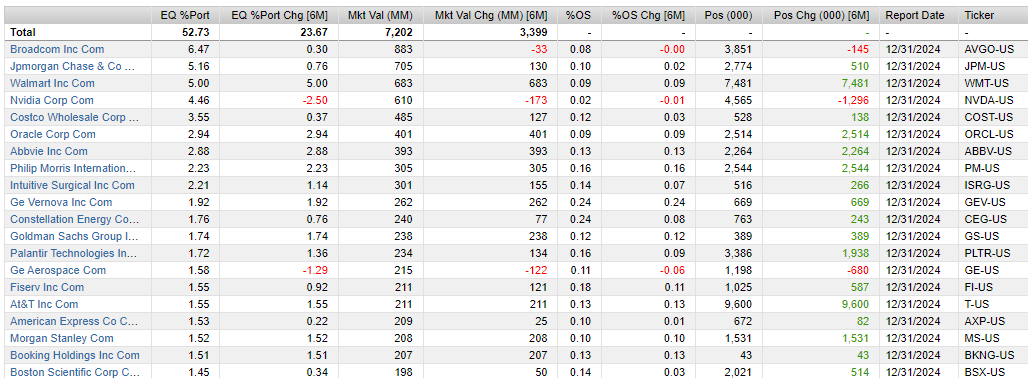
Momentum has taken the lead. Below is a look at the top 20 fund holdings for MTUM. There’s a broad mix of sectors represented on the list and only one Mag7 name (NVDA). The supports the idea that leadership is in transition away from the early pillars of this bull market cycle.
Risk On/Risk Off: Vol. Higher, Risk-Appetite Gages have been Firming
We’ve been somewhat surprised by the behavior of our “Risk & Fear Gages” throughout this correction. While stock and bond vol. was ticking higher, our performance ratios showed pro-cyclical behavior. As we consider the leadership picture, we can square their behavior by keeping in mind that economic data is getting stronger, not weaker. So while more speculative investors try to discount the Fed, business on the ground is good and earnings are more abundant than expected. That should prompt some accumulation of Value stocks which, as discussed earlier, are generally on the tails of the volatility curve.

In Conclusion
The first 3 weeks of 2025 have previewed that inflation concerns remain with us for another year. The delicate dance between economic data, fed policy expectations and interest rates will likely continue to influence equity positioning. At present, with strong economic data keeping rates firm, Value has an edge over Growth. We are expressing our alignment through sectors by being underweight Discretionary and Technology shares and overweight Financials, Energy and Utilities.
Data sourced from FactSet Research Systems Inc.
