Macro Trend Signals: Commodities Prices at a Key Pivot, Implications for Energy and Materials Sector Performance
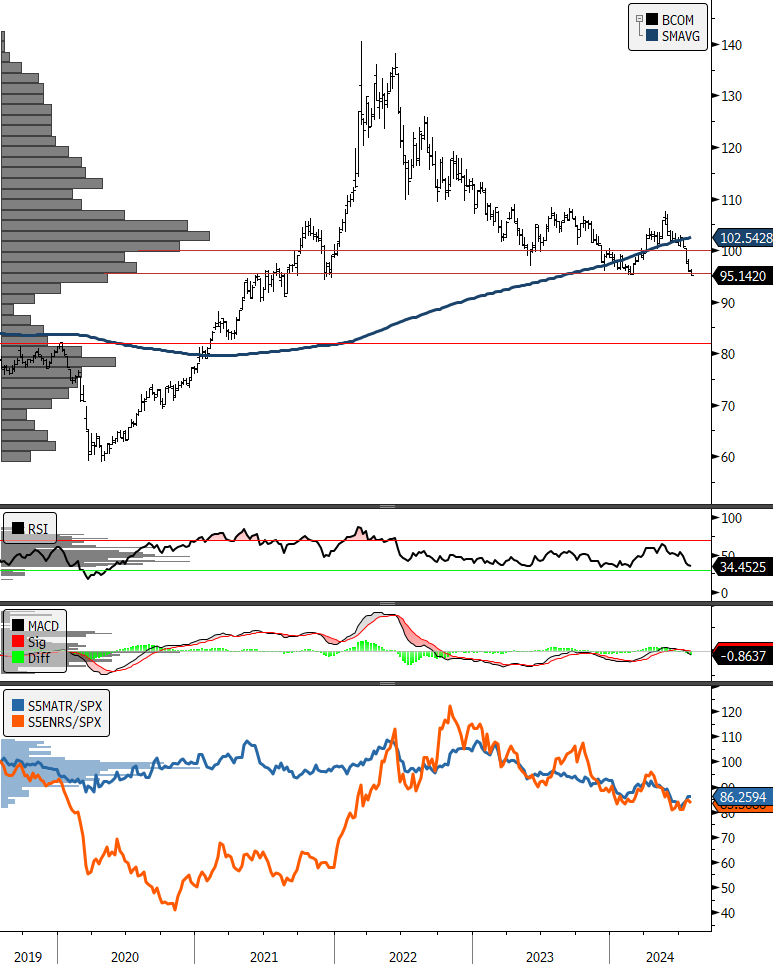
This week’s macro trend signals piece focuses on commodities prices as measured by the Bloomberg Commodities Index (BCOM). As we mentioned at the end of our weekly market letter (Narrations of a Sector ETF Operator | Weekly Market Letter, July 28, 2024 – ETF Sector), commodities prices are oversold and at support. A bounce is normally expected, but the longer-term trend for commodities prices has been weak since peaking in 2022. If we see further weakness despite price reaching support, that will confirm our negative outlook on commodities adjacent sectors Energy (XLE) and Materials (XLB). Our historical trend studies show that XLE and XLB performance swing dramatically based on the underlying trend in commodities prices with XLE the more affected of the two sectors.
Current Commodities Price Trend: DOWN

The chart above shows the Bloomberg Commodities Index on a weekly periodicity over the past 5 years. We can see the dominant price congestion zone or “point of control” on the long-term chart was between the 100 and 110 levels. Breaking through that point on the chart usually signals major trend change. In this case from up to down and suggests what had previously been a price support may now flip to acting as resistance. This has negative implications for Energy and Materials sector performance if the downtrend sustains.
S&P 500 GICS Sector Mean/Median Returns during BCOM Downtrends (1989-present)
S&P 500 GICS Sector Mean/Median Returns during BCOM Uptrends (1989-present)

Coincident returns, 4 most recent completed Bloomberg Commodities Index Downtrends

Looking at the return profiles for the 11 GICS sectors going back to 1989 we can see that downtrends in commodities prices typically coincide with lower returns at the index level as one would expect. The Energy Sector is historically the worst performing sector when Commodities prices trend lower, but it is the best performing sector when Commodities prices move higher. The market’s discounting mechanism appears to be placing a higher probability on near-term economic weakness over strength. Given the near-term corrective price action of the S&P 500 and the softness in interest rates, we think the tactical call for XLB and XLE is neutral at best.
The confounding dynamic in this cycle is the market trying to front-run Fed. by rushing to buy on news of easing interest rate policy. Eventually, we believe some sobriety will return with respect to understanding Fed. easing as a sign that the economy does in fact need some help and is stagnating despite the inflation slowing down. Anyone who is engaging in any commerce these days knows that prices are quite a bit higher than they were, say, 3 years ago.
We can see from looking at the 4 most recent Commodity Downtrend cycles that the recent beneficiaries of low Commodities prices have been the Info Tech. Sector and the Comm. Services Sector. Recently those sectors have come under pressure as the Mega Cap. Growth trade has started to unwind. We would expect that cyclical sectors won’t be able to sustain outperformance if Commodities prices remain this week, so it will be important to see a buyer step
Conclusion: Current commodities index price structure does not support sustained outperformance in XLE and XLB
While we are seeing some relief in XLE and XLB share prices from lower interest rates in the near-term, we are skeptical that the two sector funds can continue to outperform the S&P 500 with commodities prices reflecting weakening demand. Weakening commodities prices have historically coincided with underperformance in the Energy and Materials sectors and a break of support for the Bloomberg Commodities index would confirm a bearish headwind for both.
Links to our studies on coincident sector returns during uptrends and downtrends in these benchmarks can be found here:
US Sector Historical Return Profiles During Equity Uptrends – ETF Sector
US Sector Historical Return Profiles During Equity Downtrends – ETF Sector
US Sector Historical Return Profiles During Interest Rate (US 10yr Yield) Uptrends – ETF Sector
US Sector Historical Return Profiles During Interest Rate (US 10yr Yield) Downtrends – ETF Sector
US Sector Historical Return Profiles During USD Price (DXY Index) Uptrends – ETF Sector
US Sector Historical Return Profiles During USD Price (DXY Index) Downtrends – ETF Sector
Sources: Bloomberg

