
We’re proud to debut a new cyclical piece. The ETFSector.com Macro Trend Signals: Sector Deep Dive. Today we will address the S&P 500 Financial Sector to explore the historical return profiles at the industry and sub-industry level for the current macro trends in the S&P 500 and the US 10yr Treasury Yield.
Current Equity Trend: UP
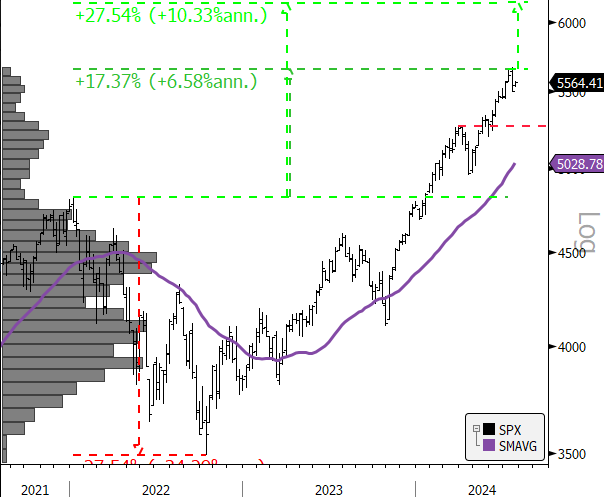
- S&P 500 3yr, weekly (200-day m.a.)
Classic price structure analysis gives a forward price target of 6145 as the upside price objective for the longer-term trend. The horizontal dotted line is near-term support at 5264. We expect the equity uptrend to continue into 2025 based on our trend following and technical inputs.
Financial Sector/Industry/Sub-Industry Historical Coincident Returns (mean/median)

Coincident returns, 4 most recent completed S&P 500 uptrends

Tailwinds: Investment Banks & Brokerage, Financial Exchanges & Data, Consumer Finance, Capital Markets
Current US 10yr Yield Trend: Transition–Downward Bias Intermediate-term
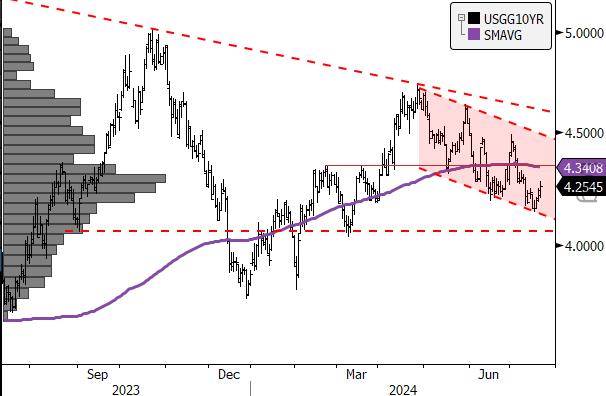
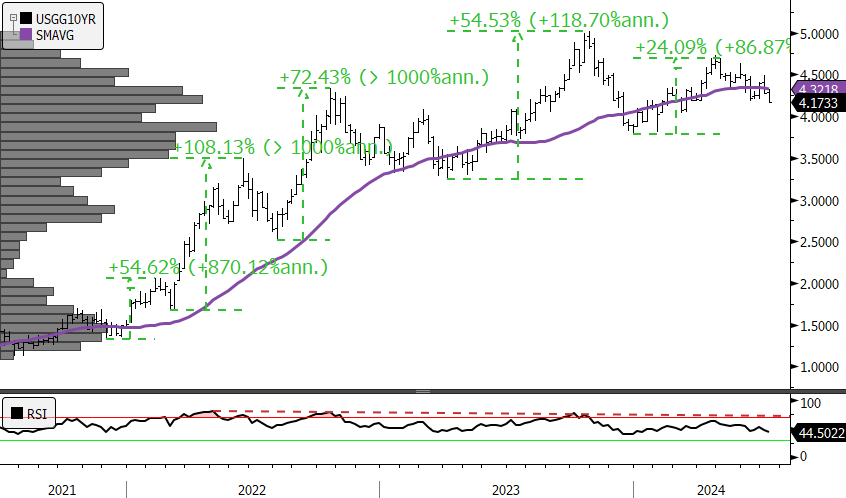
- US Generic 10yr Treasury Yield (200-day m.a.)
While the equity trend is clear at present, interest rates as measured by the US generic 10yr yield are in a sideways consolidation with increasingly distributional characteristics. That has us giving a mild benefit of the doubt to sectors that benefit from falling rates, but we ended June without a clear signal in our Elev8 portfolio model. With the 10yr yield nearing 3-months in a downtrend channel, we are heading towards a negative rate signal for August in the model. Near-term support is likely around 4.05% which is the bottom of the price congestion zone for the consolidation. Below that level is potential for increased downside momentum.
The weekly 3yr chart for the 10yr Yield shows a longer-term negative momentum divergence on the RSI study which is a characteristic of a distributional (topping) pattern. We can also see that motive upside thrusts in the yield have been losing steam as the inflation impulse has sputtered.
Given these technical characteristics we think the long-term direction of rates is likely lower. However, the overlay in the present cycle is to realize that lower rates will likely offer relief to the broad array of underperforming Sectors that have lagged due to inflation/recession fears. This is a crosscurrent that is hard to sus out in our model but keeps us a bit reserved in positioning for a traditional lower rate playbook.
US 10yr Yield Uptrends: Financial Sector/Industry/Sub-Industry Historical Coincident Returns (mean/median)

US 10yr Yield Downtrends: Financial Sector/Industry/Sub-Industry Historical Coincident Returns (mean/median)

Rates over the longer term are still in consolidation and currently register as a neutral signal in our Elev8 Sector Rotation Model. We notice in the current cycle that Diversified Banks are outperforming their historical tendency.
Conclusion: Equity Trend is Strong, Interest Rate Trend Transitioning Lower
Given the ongoing consolidation in interest rates paired with a strong equity trend, our macro studies highlight a preference for historical leaders in the latter category. Investment Banks, Brokerages, Capital Markets and Consumer Finance Industries have historically delivered in equity uptrends. A key dynamic to watch moving forward is whether further up moves in equities spark rates higher. That would put a second tailwind firmly behind the same Financial Sectors the Equity Trend Favors. At present we remain long the XLF based on softening inflation data, improving chances of an economic soft landing and a resilient bull trend with constructive technical characteristics.
Table/Chart Key
SPX = S&P 500
S5FINL = S&P 500 Financials Sector Index
S5CBNK = S&P 500 Commercial Bank Industry
S5CAPM = S&P 500 Capital Markets Industry
S5CFINX = S&P 500 Consumer Finance Industry
S5DVFS = S&P 500 Diversified Financial Services
S5INSUX = S&P 500 Insurance Industry
S5AMGT = S&P 500 Asset Management Sub-Industry
S5FEXD = S&P 500 Financial Exchanges and Data Sub-Industry
S5INBK = S&P 500 Investment Bank & Brokerage Sub-Industry
S5TPPPSI = S&P 500 Thrift & Mortgage Finance Sub-Industry
S5PROP = S&P 500 Property & Casualty Sub-Industry
S5LIFE = S&P 500 Life Insurance Sub-Industry
S5INSB = S&P 500 Insurance Brokers Sub-Industry
S5DBNK = S&P 500 Diversified Banking Sub-Industry
S5RBNK = S&P 500 Regional Banking Sub-Industry
Links to our studies on coincident sector returns during uptrends and downtrends in these benchmarks can be found here:
US Sector Historical Return Profiles During Equity Uptrends – ETF Sector
US Sector Historical Return Profiles During Equity Downtrends – ETF Sector
US Sector Historical Return Profiles During Interest Rate (US 10yr Yield) Uptrends – ETF Sector
US Sector Historical Return Profiles During Interest Rate (US 10yr Yield) Downtrends – ETF Sector
US Sector Historical Return Profiles During USD Price (DXY Index) Uptrends – ETF Sector
US Sector Historical Return Profiles During USD Price (DXY Index) Downtrends – ETF Sector
Sources: Bloomberg
